Choctaw vs Immigrants from Argentina Single Father Households
COMPARE
Choctaw
Immigrants from Argentina
Single Father Households
Single Father Households Comparison
Choctaw
Immigrants from Argentina
2.7%
SINGLE FATHER HOUSEHOLDS
0.0/ 100
METRIC RATING
292nd/ 347
METRIC RANK
2.2%
SINGLE FATHER HOUSEHOLDS
98.1/ 100
METRIC RATING
116th/ 347
METRIC RANK
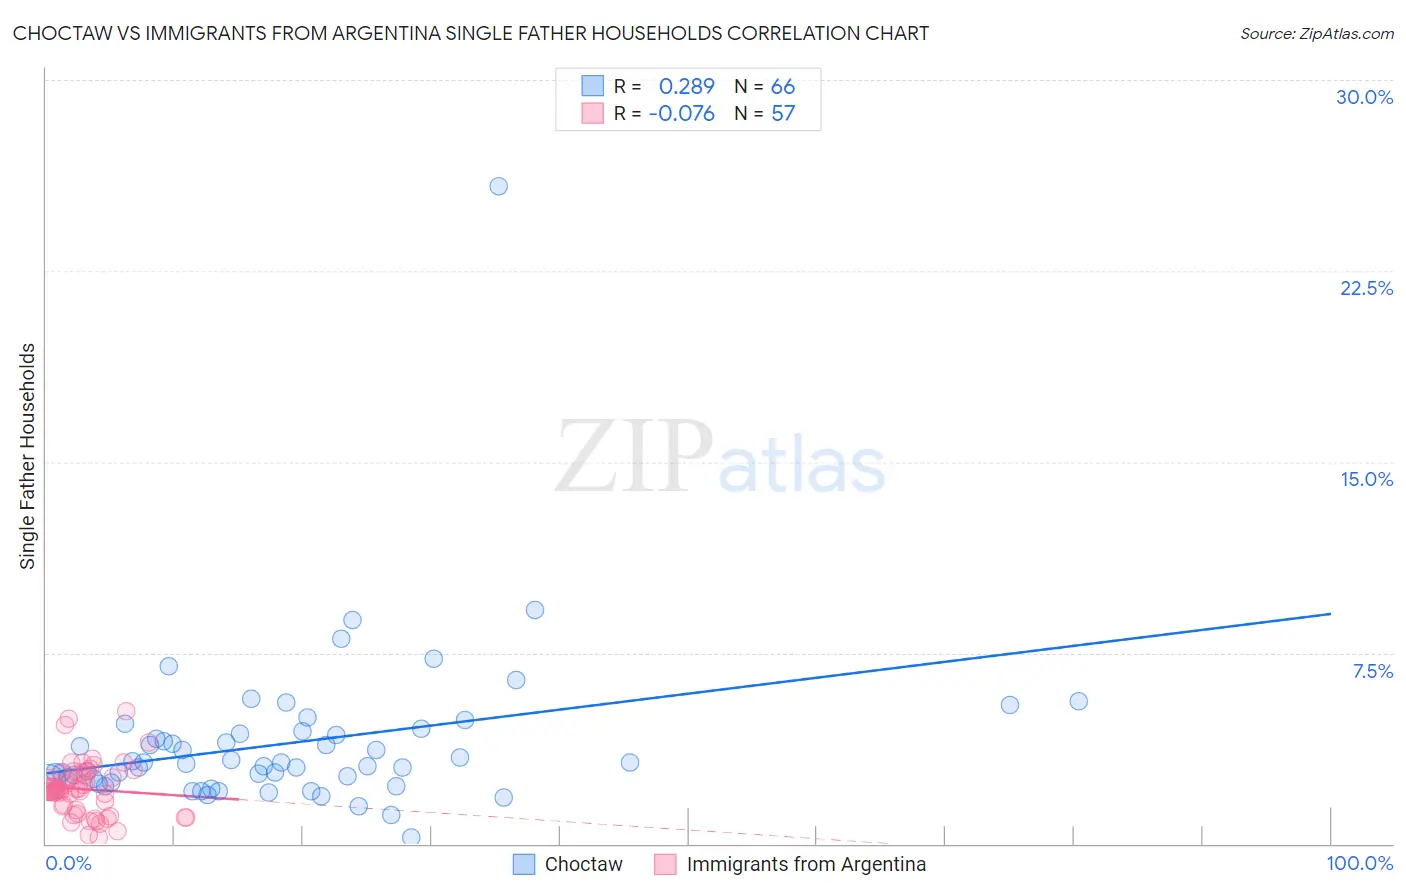
Choctaw vs Immigrants from Argentina Single Father Households Correlation Chart
The statistical analysis conducted on geographies consisting of 267,840,936 people shows a weak positive correlation between the proportion of Choctaw and percentage of single father households in the United States with a correlation coefficient (R) of 0.289 and weighted average of 2.7%. Similarly, the statistical analysis conducted on geographies consisting of 263,186,276 people shows a slight negative correlation between the proportion of Immigrants from Argentina and percentage of single father households in the United States with a correlation coefficient (R) of -0.076 and weighted average of 2.2%, a difference of 25.2%.
Single Father Households Correlation Summary
| Measurement | Choctaw | Immigrants from Argentina |
| Minimum | 0.27% | 0.26% |
| Maximum | 25.8% | 5.2% |
| Range | 25.5% | 5.0% |
| Mean | 3.9% | 2.1% |
| Median | 3.2% | 2.1% |
| Interquartile 25% (IQ1) | 2.4% | 1.2% |
| Interquartile 75% (IQ3) | 4.3% | 2.8% |
| Interquartile Range (IQR) | 1.9% | 1.5% |
| Standard Deviation (Sample) | 3.2% | 1.1% |
| Standard Deviation (Population) | 3.2% | 1.0% |
Similar Demographics by Single Father Households
Demographics Similar to Choctaw by Single Father Households
In terms of single father households, the demographic groups most similar to Choctaw are Immigrants from Fiji (2.7%, a difference of 0.16%), Blackfeet (2.7%, a difference of 0.46%), Malaysian (2.7%, a difference of 0.59%), Puget Sound Salish (2.7%, a difference of 1.0%), and Chickasaw (2.8%, a difference of 1.4%).
| Demographics | Rating | Rank | Single Father Households |
| Ottawa | 0.1 /100 | #285 | Tragic 2.7% |
| Immigrants | Cuba | 0.1 /100 | #286 | Tragic 2.7% |
| Central American Indians | 0.0 /100 | #287 | Tragic 2.7% |
| Immigrants | Cambodia | 0.0 /100 | #288 | Tragic 2.7% |
| Tlingit-Haida | 0.0 /100 | #289 | Tragic 2.7% |
| Puget Sound Salish | 0.0 /100 | #290 | Tragic 2.7% |
| Blackfeet | 0.0 /100 | #291 | Tragic 2.7% |
| Choctaw | 0.0 /100 | #292 | Tragic 2.7% |
| Immigrants | Fiji | 0.0 /100 | #293 | Tragic 2.7% |
| Malaysians | 0.0 /100 | #294 | Tragic 2.7% |
| Chickasaw | 0.0 /100 | #295 | Tragic 2.8% |
| Japanese | 0.0 /100 | #296 | Tragic 2.8% |
| Hondurans | 0.0 /100 | #297 | Tragic 2.8% |
| Cree | 0.0 /100 | #298 | Tragic 2.8% |
| Lumbee | 0.0 /100 | #299 | Tragic 2.8% |
Demographics Similar to Immigrants from Argentina by Single Father Households
In terms of single father households, the demographic groups most similar to Immigrants from Argentina are Immigrants from Barbados (2.2%, a difference of 0.030%), Immigrants from North America (2.2%, a difference of 0.060%), Iraqi (2.2%, a difference of 0.10%), Immigrants from Trinidad and Tobago (2.2%, a difference of 0.11%), and Immigrants from Canada (2.2%, a difference of 0.15%).
| Demographics | Rating | Rank | Single Father Households |
| Barbadians | 98.4 /100 | #109 | Exceptional 2.2% |
| Italians | 98.3 /100 | #110 | Exceptional 2.2% |
| Immigrants | Canada | 98.3 /100 | #111 | Exceptional 2.2% |
| Immigrants | Trinidad and Tobago | 98.2 /100 | #112 | Exceptional 2.2% |
| Iraqis | 98.2 /100 | #113 | Exceptional 2.2% |
| Immigrants | North America | 98.2 /100 | #114 | Exceptional 2.2% |
| Immigrants | Barbados | 98.2 /100 | #115 | Exceptional 2.2% |
| Immigrants | Argentina | 98.1 /100 | #116 | Exceptional 2.2% |
| Hungarians | 97.9 /100 | #117 | Exceptional 2.2% |
| Immigrants | Morocco | 97.8 /100 | #118 | Exceptional 2.2% |
| Trinidadians and Tobagonians | 97.8 /100 | #119 | Exceptional 2.2% |
| Australians | 97.7 /100 | #120 | Exceptional 2.2% |
| Immigrants | Brazil | 97.7 /100 | #121 | Exceptional 2.2% |
| Immigrants | Iraq | 97.6 /100 | #122 | Exceptional 2.2% |
| Immigrants | Yemen | 97.5 /100 | #123 | Exceptional 2.2% |