Chippewa vs Russian 11th Grade
COMPARE
Chippewa
Russian
11th Grade
11th Grade Comparison
Chippewa
Russians
93.5%
11TH GRADE
98.6/ 100
METRIC RATING
102nd/ 347
METRIC RANK
94.3%
11TH GRADE
100.0/ 100
METRIC RATING
30th/ 347
METRIC RANK
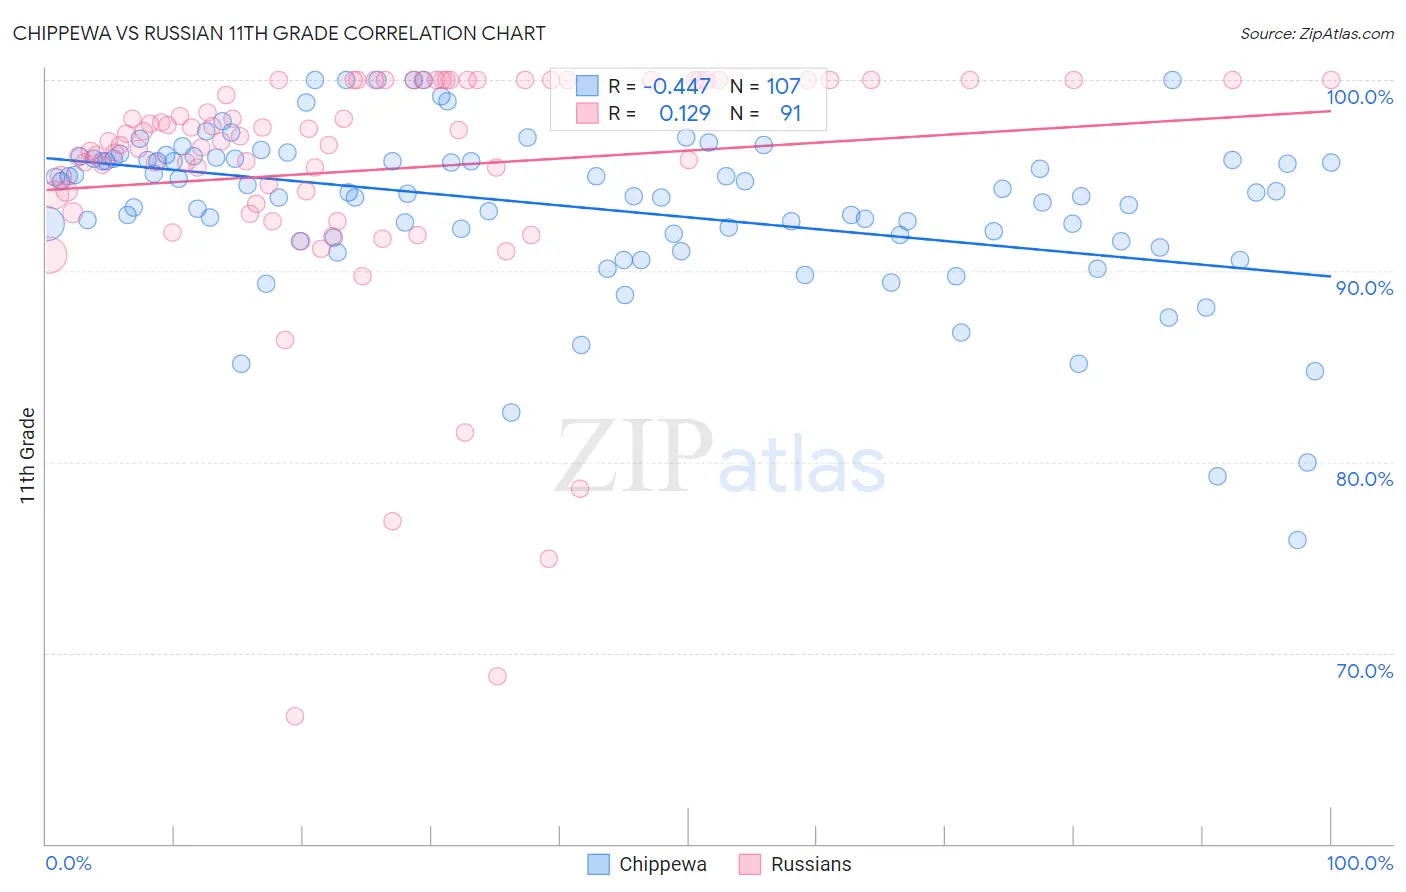
Chippewa vs Russian 11th Grade Correlation Chart
The statistical analysis conducted on geographies consisting of 215,068,316 people shows a moderate negative correlation between the proportion of Chippewa and percentage of population with at least 11th grade education in the United States with a correlation coefficient (R) of -0.447 and weighted average of 93.5%. Similarly, the statistical analysis conducted on geographies consisting of 512,259,122 people shows a poor positive correlation between the proportion of Russians and percentage of population with at least 11th grade education in the United States with a correlation coefficient (R) of 0.129 and weighted average of 94.3%, a difference of 0.82%.
11th Grade Correlation Summary
| Measurement | Chippewa | Russian |
| Minimum | 75.9% | 66.7% |
| Maximum | 100.0% | 100.0% |
| Range | 24.1% | 33.3% |
| Mean | 93.4% | 95.3% |
| Median | 94.1% | 96.8% |
| Interquartile 25% (IQ1) | 91.8% | 94.0% |
| Interquartile 75% (IQ3) | 95.9% | 100.0% |
| Interquartile Range (IQR) | 4.1% | 6.0% |
| Standard Deviation (Sample) | 4.3% | 6.5% |
| Standard Deviation (Population) | 4.3% | 6.4% |
Similar Demographics by 11th Grade
Demographics Similar to Chippewa by 11th Grade
In terms of 11th grade, the demographic groups most similar to Chippewa are Lebanese (93.5%, a difference of 0.0%), Immigrants from Europe (93.5%, a difference of 0.0%), Immigrants from Serbia (93.5%, a difference of 0.0%), Immigrants from Romania (93.5%, a difference of 0.010%), and Immigrants from Croatia (93.5%, a difference of 0.010%).
| Demographics | Rating | Rank | 11th Grade |
| Immigrants | France | 99.0 /100 | #95 | Exceptional 93.6% |
| Immigrants | Turkey | 98.9 /100 | #96 | Exceptional 93.5% |
| Immigrants | Iran | 98.9 /100 | #97 | Exceptional 93.5% |
| Immigrants | Israel | 98.8 /100 | #98 | Exceptional 93.5% |
| Menominee | 98.7 /100 | #99 | Exceptional 93.5% |
| Immigrants | North Macedonia | 98.7 /100 | #100 | Exceptional 93.5% |
| Immigrants | Romania | 98.7 /100 | #101 | Exceptional 93.5% |
| Chippewa | 98.6 /100 | #102 | Exceptional 93.5% |
| Lebanese | 98.6 /100 | #103 | Exceptional 93.5% |
| Immigrants | Europe | 98.6 /100 | #104 | Exceptional 93.5% |
| Immigrants | Serbia | 98.6 /100 | #105 | Exceptional 93.5% |
| Immigrants | Croatia | 98.6 /100 | #106 | Exceptional 93.5% |
| Immigrants | Norway | 98.4 /100 | #107 | Exceptional 93.5% |
| Alaska Natives | 98.4 /100 | #108 | Exceptional 93.5% |
| Immigrants | Kuwait | 98.4 /100 | #109 | Exceptional 93.5% |
Demographics Similar to Russians by 11th Grade
In terms of 11th grade, the demographic groups most similar to Russians are Welsh (94.2%, a difference of 0.020%), Belgian (94.2%, a difference of 0.020%), British (94.2%, a difference of 0.050%), Immigrants from Scotland (94.2%, a difference of 0.060%), and Immigrants from Singapore (94.2%, a difference of 0.060%).
| Demographics | Rating | Rank | 11th Grade |
| Czechs | 100.0 /100 | #23 | Exceptional 94.4% |
| English | 100.0 /100 | #24 | Exceptional 94.4% |
| Irish | 100.0 /100 | #25 | Exceptional 94.4% |
| Scottish | 100.0 /100 | #26 | Exceptional 94.4% |
| Europeans | 100.0 /100 | #27 | Exceptional 94.4% |
| Estonians | 100.0 /100 | #28 | Exceptional 94.4% |
| Dutch | 100.0 /100 | #29 | Exceptional 94.3% |
| Russians | 100.0 /100 | #30 | Exceptional 94.3% |
| Welsh | 99.9 /100 | #31 | Exceptional 94.2% |
| Belgians | 99.9 /100 | #32 | Exceptional 94.2% |
| British | 99.9 /100 | #33 | Exceptional 94.2% |
| Immigrants | Scotland | 99.9 /100 | #34 | Exceptional 94.2% |
| Immigrants | Singapore | 99.9 /100 | #35 | Exceptional 94.2% |
| Immigrants | Northern Europe | 99.9 /100 | #36 | Exceptional 94.2% |
| Northern Europeans | 99.9 /100 | #37 | Exceptional 94.2% |