Immigrants from Ireland vs Russian Median Earnings
COMPARE
Immigrants from Ireland
Russian
Median Earnings
Median Earnings Comparison
Immigrants from Ireland
Russians
$56,854
MEDIAN EARNINGS
100.0/ 100
METRIC RATING
12th/ 347
METRIC RANK
$53,334
MEDIAN EARNINGS
100.0/ 100
METRIC RATING
31st/ 347
METRIC RANK
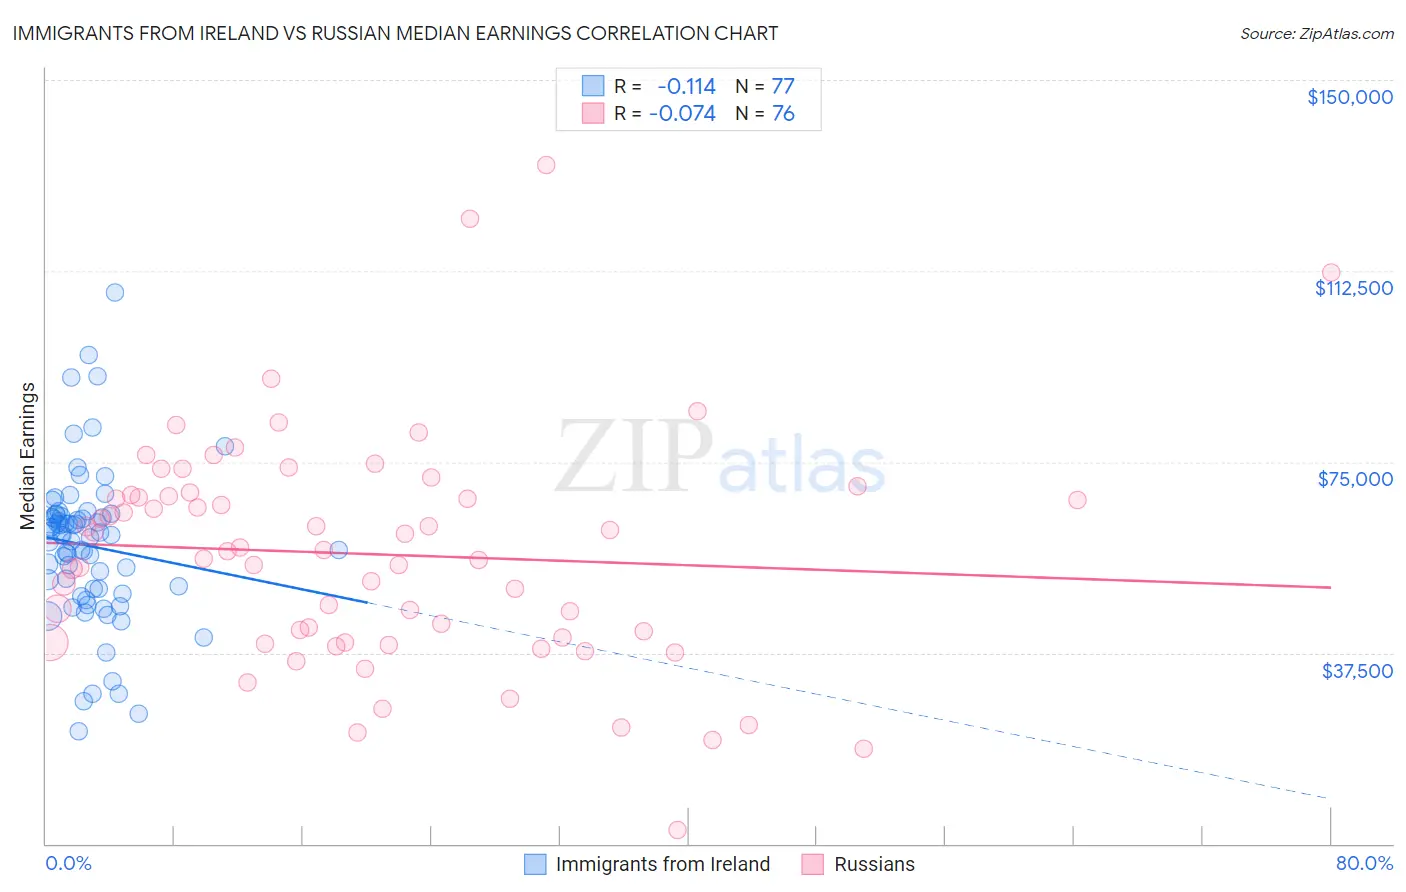
Immigrants from Ireland vs Russian Median Earnings Correlation Chart
The statistical analysis conducted on geographies consisting of 240,768,964 people shows a poor negative correlation between the proportion of Immigrants from Ireland and median earnings in the United States with a correlation coefficient (R) of -0.114 and weighted average of $56,854. Similarly, the statistical analysis conducted on geographies consisting of 512,155,619 people shows a slight negative correlation between the proportion of Russians and median earnings in the United States with a correlation coefficient (R) of -0.074 and weighted average of $53,334, a difference of 6.6%.
Median Earnings Correlation Summary
| Measurement | Immigrants from Ireland | Russian |
| Minimum | $22,198 | $2,766 |
| Maximum | $108,333 | $133,235 |
| Range | $86,135 | $130,469 |
| Mean | $58,485 | $56,899 |
| Median | $60,577 | $57,547 |
| Interquartile 25% (IQ1) | $49,600 | $40,132 |
| Interquartile 75% (IQ3) | $64,376 | $68,448 |
| Interquartile Range (IQR) | $14,776 | $28,315 |
| Standard Deviation (Sample) | $15,214 | $22,580 |
| Standard Deviation (Population) | $15,114 | $22,431 |
Demographics Similar to Immigrants from Ireland and Russians by Median Earnings
In terms of median earnings, the demographic groups most similar to Immigrants from Ireland are Immigrants from Israel ($57,034, a difference of 0.32%), Immigrants from China ($56,638, a difference of 0.38%), Immigrants from Australia ($56,305, a difference of 0.97%), Indian (Asian) ($56,253, a difference of 1.1%), and Immigrants from Eastern Asia ($56,183, a difference of 1.2%). Similarly, the demographic groups most similar to Russians are Cambodian ($53,386, a difference of 0.10%), Immigrants from Russia ($53,457, a difference of 0.23%), Immigrants from France ($53,490, a difference of 0.29%), Asian ($53,690, a difference of 0.67%), and Immigrants from Northern Europe ($53,872, a difference of 1.0%).
| Demographics | Rating | Rank | Median Earnings |
| Immigrants | Israel | 100.0 /100 | #11 | Exceptional $57,034 |
| Immigrants | Ireland | 100.0 /100 | #12 | Exceptional $56,854 |
| Immigrants | China | 100.0 /100 | #13 | Exceptional $56,638 |
| Immigrants | Australia | 100.0 /100 | #14 | Exceptional $56,305 |
| Indians (Asian) | 100.0 /100 | #15 | Exceptional $56,253 |
| Immigrants | Eastern Asia | 100.0 /100 | #16 | Exceptional $56,183 |
| Eastern Europeans | 100.0 /100 | #17 | Exceptional $55,084 |
| Immigrants | Japan | 100.0 /100 | #18 | Exceptional $54,938 |
| Immigrants | Belgium | 100.0 /100 | #19 | Exceptional $54,679 |
| Cypriots | 100.0 /100 | #20 | Exceptional $54,589 |
| Burmese | 100.0 /100 | #21 | Exceptional $54,559 |
| Immigrants | Korea | 100.0 /100 | #22 | Exceptional $54,530 |
| Immigrants | Sweden | 100.0 /100 | #23 | Exceptional $54,478 |
| Soviet Union | 100.0 /100 | #24 | Exceptional $54,290 |
| Turks | 100.0 /100 | #25 | Exceptional $53,919 |
| Immigrants | Northern Europe | 100.0 /100 | #26 | Exceptional $53,872 |
| Asians | 100.0 /100 | #27 | Exceptional $53,690 |
| Immigrants | France | 100.0 /100 | #28 | Exceptional $53,490 |
| Immigrants | Russia | 100.0 /100 | #29 | Exceptional $53,457 |
| Cambodians | 100.0 /100 | #30 | Exceptional $53,386 |
| Russians | 100.0 /100 | #31 | Exceptional $53,334 |