Chippewa vs Immigrants from Zimbabwe Births to Unmarried Women
COMPARE
Chippewa
Immigrants from Zimbabwe
Births to Unmarried Women
Births to Unmarried Women Comparison
Chippewa
Immigrants from Zimbabwe
42.6%
BIRTHS TO UNMARRIED WOMEN
0.0/ 100
METRIC RATING
330th/ 347
METRIC RANK
30.3%
BIRTHS TO UNMARRIED WOMEN
85.7/ 100
METRIC RATING
131st/ 347
METRIC RANK
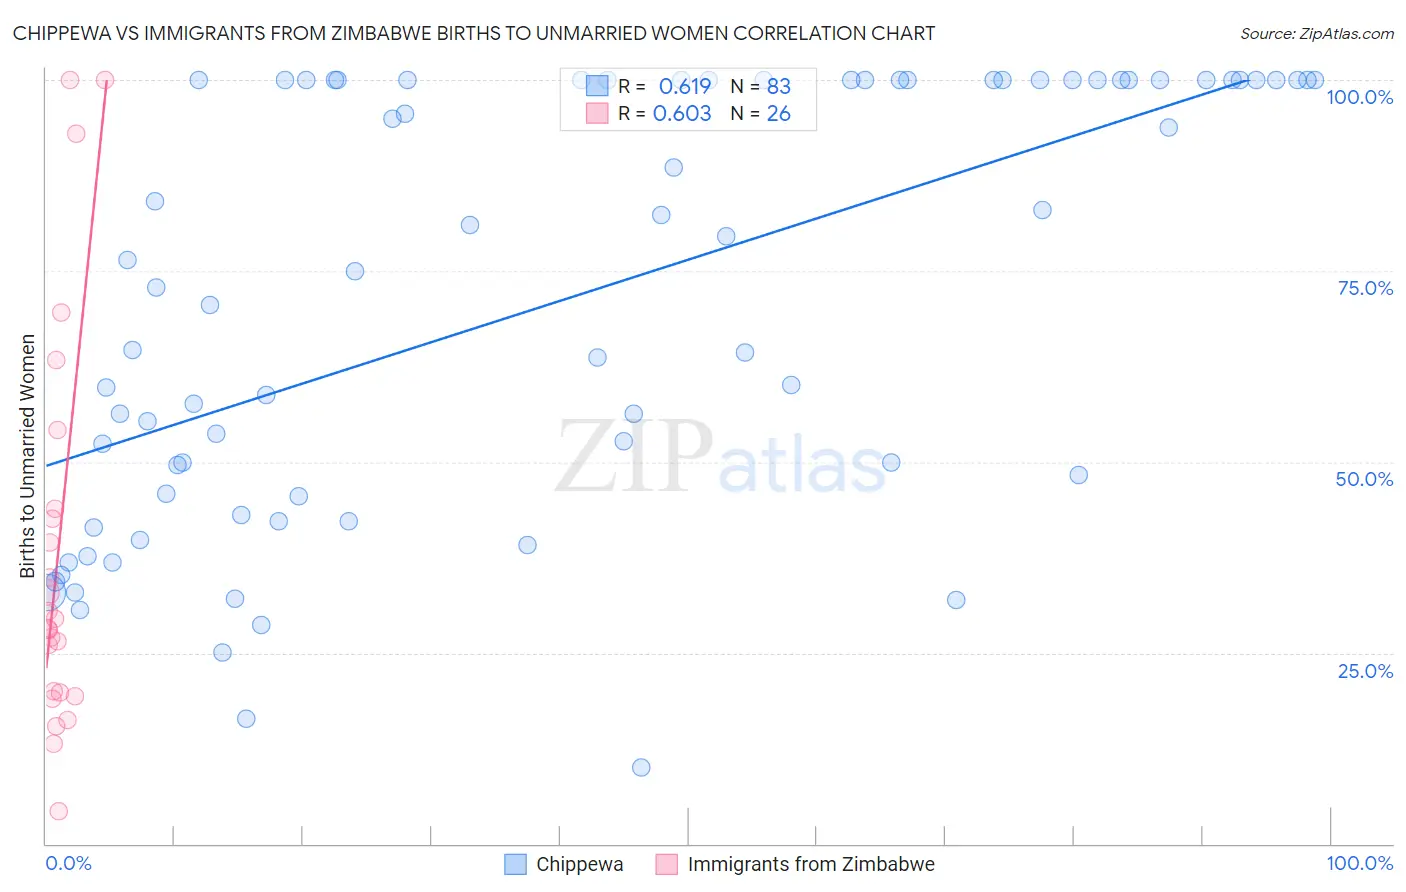
Chippewa vs Immigrants from Zimbabwe Births to Unmarried Women Correlation Chart
The statistical analysis conducted on geographies consisting of 205,326,129 people shows a significant positive correlation between the proportion of Chippewa and percentage of births to unmarried women in the United States with a correlation coefficient (R) of 0.619 and weighted average of 42.6%. Similarly, the statistical analysis conducted on geographies consisting of 114,747,044 people shows a significant positive correlation between the proportion of Immigrants from Zimbabwe and percentage of births to unmarried women in the United States with a correlation coefficient (R) of 0.603 and weighted average of 30.3%, a difference of 40.5%.
Births to Unmarried Women Correlation Summary
| Measurement | Chippewa | Immigrants from Zimbabwe |
| Minimum | 10.0% | 4.3% |
| Maximum | 100.0% | 100.0% |
| Range | 90.0% | 95.7% |
| Mean | 71.0% | 38.3% |
| Median | 75.0% | 28.8% |
| Interquartile 25% (IQ1) | 45.5% | 19.7% |
| Interquartile 75% (IQ3) | 100.0% | 43.8% |
| Interquartile Range (IQR) | 54.5% | 24.1% |
| Standard Deviation (Sample) | 27.9% | 26.5% |
| Standard Deviation (Population) | 27.7% | 26.0% |
Similar Demographics by Births to Unmarried Women
Demographics Similar to Chippewa by Births to Unmarried Women
In terms of births to unmarried women, the demographic groups most similar to Chippewa are Paiute (42.5%, a difference of 0.40%), Native/Alaskan (43.0%, a difference of 0.83%), Immigrants from Cabo Verde (42.2%, a difference of 1.0%), Tsimshian (42.2%, a difference of 1.1%), and Kiowa (43.1%, a difference of 1.2%).
| Demographics | Rating | Rank | Births to Unmarried Women |
| Sioux | 0.0 /100 | #323 | Tragic 41.0% |
| Cape Verdeans | 0.0 /100 | #324 | Tragic 41.3% |
| Cheyenne | 0.0 /100 | #325 | Tragic 41.3% |
| Immigrants | Cuba | 0.0 /100 | #326 | Tragic 41.5% |
| Tsimshian | 0.0 /100 | #327 | Tragic 42.2% |
| Immigrants | Cabo Verde | 0.0 /100 | #328 | Tragic 42.2% |
| Paiute | 0.0 /100 | #329 | Tragic 42.5% |
| Chippewa | 0.0 /100 | #330 | Tragic 42.6% |
| Natives/Alaskans | 0.0 /100 | #331 | Tragic 43.0% |
| Kiowa | 0.0 /100 | #332 | Tragic 43.1% |
| Blacks/African Americans | 0.0 /100 | #333 | Tragic 44.3% |
| Yuman | 0.0 /100 | #334 | Tragic 44.4% |
| Colville | 0.0 /100 | #335 | Tragic 45.3% |
| Puerto Ricans | 0.0 /100 | #336 | Tragic 45.7% |
| Houma | 0.0 /100 | #337 | Tragic 46.6% |
Demographics Similar to Immigrants from Zimbabwe by Births to Unmarried Women
In terms of births to unmarried women, the demographic groups most similar to Immigrants from Zimbabwe are Immigrants from Bosnia and Herzegovina (30.3%, a difference of 0.010%), Immigrants from Spain (30.3%, a difference of 0.020%), New Zealander (30.3%, a difference of 0.030%), Icelander (30.3%, a difference of 0.060%), and Immigrants from Morocco (30.4%, a difference of 0.080%).
| Demographics | Rating | Rank | Births to Unmarried Women |
| Croatians | 88.0 /100 | #124 | Excellent 30.2% |
| Vietnamese | 87.7 /100 | #125 | Excellent 30.2% |
| Europeans | 87.2 /100 | #126 | Excellent 30.2% |
| Chinese | 87.1 /100 | #127 | Excellent 30.2% |
| Icelanders | 86.0 /100 | #128 | Excellent 30.3% |
| Immigrants | Spain | 85.8 /100 | #129 | Excellent 30.3% |
| Immigrants | Bosnia and Herzegovina | 85.7 /100 | #130 | Excellent 30.3% |
| Immigrants | Zimbabwe | 85.7 /100 | #131 | Excellent 30.3% |
| New Zealanders | 85.5 /100 | #132 | Excellent 30.3% |
| Immigrants | Morocco | 85.2 /100 | #133 | Excellent 30.4% |
| Immigrants | South Eastern Asia | 85.2 /100 | #134 | Excellent 30.4% |
| Brazilians | 84.8 /100 | #135 | Excellent 30.4% |
| Immigrants | Scotland | 84.6 /100 | #136 | Excellent 30.4% |
| Immigrants | Philippines | 83.9 /100 | #137 | Excellent 30.4% |
| Puget Sound Salish | 83.9 /100 | #138 | Excellent 30.4% |