Polish vs Immigrants from Sudan Median Male Earnings
COMPARE
Polish
Immigrants from Sudan
Median Male Earnings
Median Male Earnings Comparison
Poles
Immigrants from Sudan
$58,139
MEDIAN MALE EARNINGS
97.3/ 100
METRIC RATING
103rd/ 347
METRIC RANK
$51,489
MEDIAN MALE EARNINGS
5.0/ 100
METRIC RATING
225th/ 347
METRIC RANK
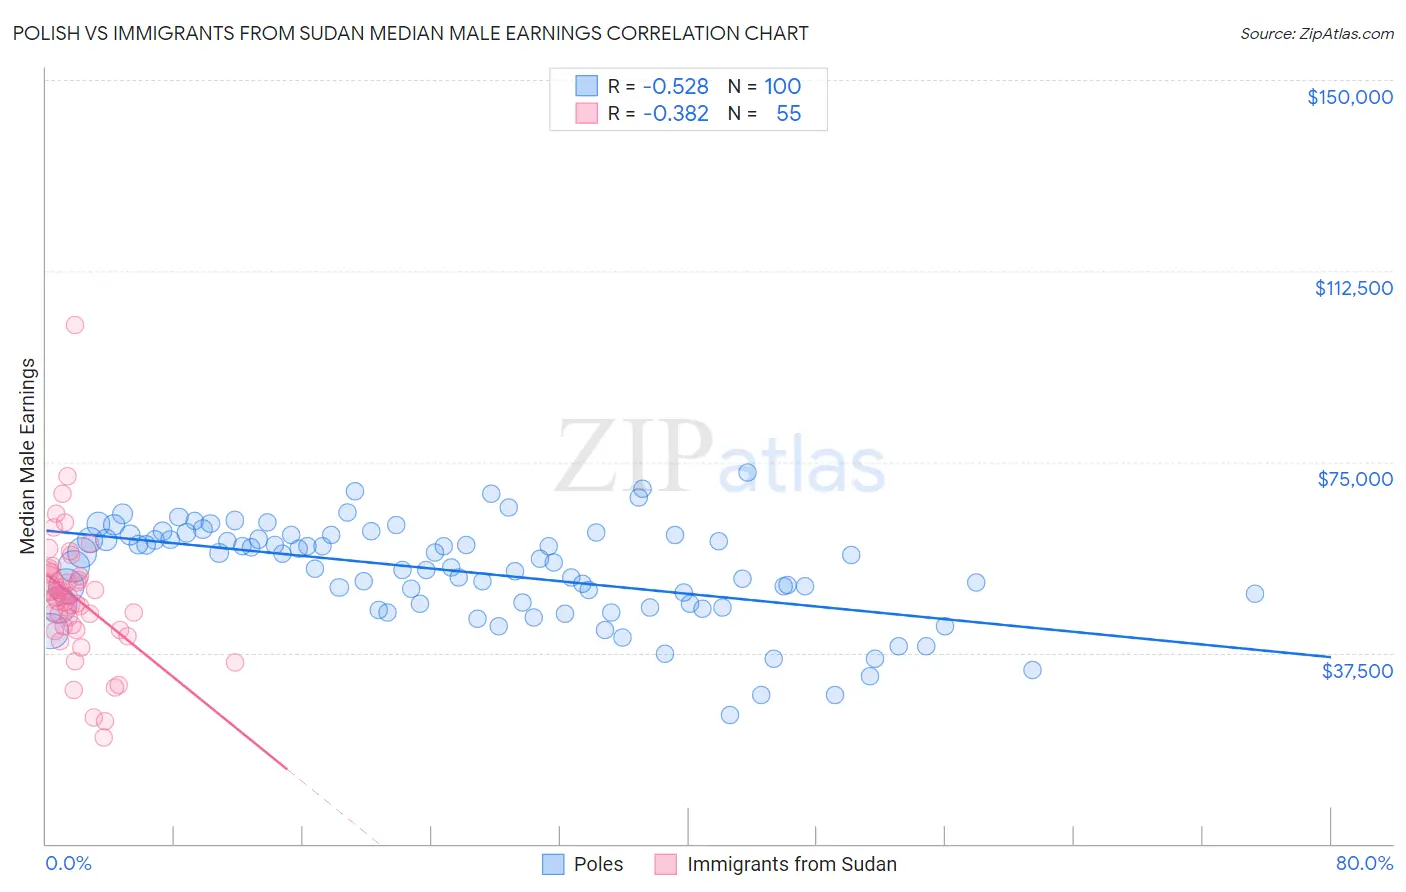
Polish vs Immigrants from Sudan Median Male Earnings Correlation Chart
The statistical analysis conducted on geographies consisting of 559,585,611 people shows a substantial negative correlation between the proportion of Poles and median male earnings in the United States with a correlation coefficient (R) of -0.528 and weighted average of $58,139. Similarly, the statistical analysis conducted on geographies consisting of 118,955,444 people shows a mild negative correlation between the proportion of Immigrants from Sudan and median male earnings in the United States with a correlation coefficient (R) of -0.382 and weighted average of $51,489, a difference of 12.9%.
Median Male Earnings Correlation Summary
| Measurement | Polish | Immigrants from Sudan |
| Minimum | $25,204 | $20,893 |
| Maximum | $72,933 | $101,789 |
| Range | $47,729 | $80,896 |
| Mean | $53,382 | $48,264 |
| Median | $54,879 | $48,306 |
| Interquartile 25% (IQ1) | $46,953 | $42,060 |
| Interquartile 75% (IQ3) | $60,187 | $53,241 |
| Interquartile Range (IQR) | $13,234 | $11,181 |
| Standard Deviation (Sample) | $9,652 | $12,693 |
| Standard Deviation (Population) | $9,604 | $12,577 |
Similar Demographics by Median Male Earnings
Demographics Similar to Poles by Median Male Earnings
In terms of median male earnings, the demographic groups most similar to Poles are Armenian ($58,134, a difference of 0.010%), Immigrants from Western Asia ($58,131, a difference of 0.020%), Syrian ($58,187, a difference of 0.080%), Immigrants from Northern Africa ($58,008, a difference of 0.23%), and Serbian ($57,975, a difference of 0.28%).
| Demographics | Rating | Rank | Median Male Earnings |
| Albanians | 98.4 /100 | #96 | Exceptional $58,680 |
| Northern Europeans | 98.2 /100 | #97 | Exceptional $58,588 |
| Jordanians | 98.1 /100 | #98 | Exceptional $58,500 |
| Immigrants | Poland | 98.0 /100 | #99 | Exceptional $58,452 |
| Assyrians/Chaldeans/Syriacs | 97.9 /100 | #100 | Exceptional $58,437 |
| Immigrants | Brazil | 97.7 /100 | #101 | Exceptional $58,324 |
| Syrians | 97.4 /100 | #102 | Exceptional $58,187 |
| Poles | 97.3 /100 | #103 | Exceptional $58,139 |
| Armenians | 97.3 /100 | #104 | Exceptional $58,134 |
| Immigrants | Western Asia | 97.3 /100 | #105 | Exceptional $58,131 |
| Immigrants | Northern Africa | 96.9 /100 | #106 | Exceptional $58,008 |
| Serbians | 96.8 /100 | #107 | Exceptional $57,975 |
| Immigrants | Uzbekistan | 96.7 /100 | #108 | Exceptional $57,941 |
| British | 96.5 /100 | #109 | Exceptional $57,890 |
| Palestinians | 96.2 /100 | #110 | Exceptional $57,778 |
Demographics Similar to Immigrants from Sudan by Median Male Earnings
In terms of median male earnings, the demographic groups most similar to Immigrants from Sudan are Japanese ($51,473, a difference of 0.030%), Trinidadian and Tobagonian ($51,446, a difference of 0.080%), Samoan ($51,389, a difference of 0.19%), Immigrants from Cambodia ($51,594, a difference of 0.20%), and Ecuadorian ($51,596, a difference of 0.21%).
| Demographics | Rating | Rank | Median Male Earnings |
| Immigrants | Panama | 7.7 /100 | #218 | Tragic $51,962 |
| Immigrants | Ghana | 6.9 /100 | #219 | Tragic $51,836 |
| Immigrants | Armenia | 6.6 /100 | #220 | Tragic $51,793 |
| Immigrants | Senegal | 5.8 /100 | #221 | Tragic $51,647 |
| Immigrants | Bangladesh | 5.8 /100 | #222 | Tragic $51,642 |
| Ecuadorians | 5.5 /100 | #223 | Tragic $51,596 |
| Immigrants | Cambodia | 5.5 /100 | #224 | Tragic $51,594 |
| Immigrants | Sudan | 5.0 /100 | #225 | Tragic $51,489 |
| Japanese | 4.9 /100 | #226 | Tragic $51,473 |
| Trinidadians and Tobagonians | 4.8 /100 | #227 | Tragic $51,446 |
| Samoans | 4.6 /100 | #228 | Tragic $51,389 |
| Immigrants | Trinidad and Tobago | 4.5 /100 | #229 | Tragic $51,376 |
| Immigrants | Nigeria | 4.2 /100 | #230 | Tragic $51,310 |
| Barbadians | 3.9 /100 | #231 | Tragic $51,236 |
| Sudanese | 3.9 /100 | #232 | Tragic $51,216 |