Immigrants from Costa Rica vs Immigrants from Sudan Median Male Earnings
COMPARE
Immigrants from Costa Rica
Immigrants from Sudan
Median Male Earnings
Median Male Earnings Comparison
Immigrants from Costa Rica
Immigrants from Sudan
$53,237
MEDIAN MALE EARNINGS
22.6/ 100
METRIC RATING
198th/ 347
METRIC RANK
$51,489
MEDIAN MALE EARNINGS
5.0/ 100
METRIC RATING
225th/ 347
METRIC RANK
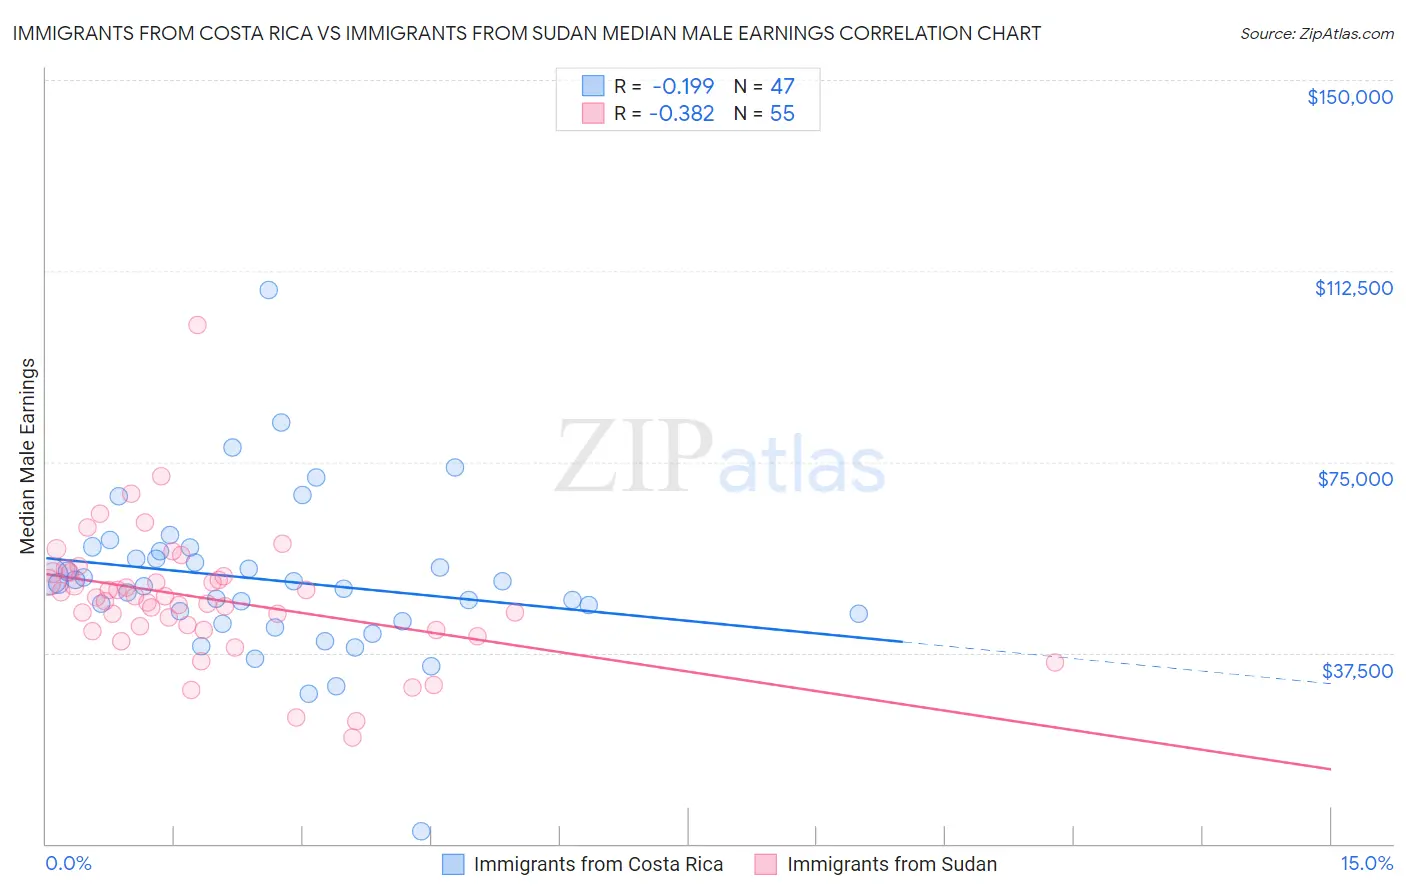
Immigrants from Costa Rica vs Immigrants from Sudan Median Male Earnings Correlation Chart
The statistical analysis conducted on geographies consisting of 204,258,977 people shows a poor negative correlation between the proportion of Immigrants from Costa Rica and median male earnings in the United States with a correlation coefficient (R) of -0.199 and weighted average of $53,237. Similarly, the statistical analysis conducted on geographies consisting of 118,955,444 people shows a mild negative correlation between the proportion of Immigrants from Sudan and median male earnings in the United States with a correlation coefficient (R) of -0.382 and weighted average of $51,489, a difference of 3.4%.
Median Male Earnings Correlation Summary
| Measurement | Immigrants from Costa Rica | Immigrants from Sudan |
| Minimum | $2,499 | $20,893 |
| Maximum | $108,694 | $101,789 |
| Range | $106,195 | $80,896 |
| Mean | $51,781 | $48,264 |
| Median | $51,130 | $48,306 |
| Interquartile 25% (IQ1) | $43,645 | $42,060 |
| Interquartile 75% (IQ3) | $57,328 | $53,241 |
| Interquartile Range (IQR) | $13,682 | $11,181 |
| Standard Deviation (Sample) | $15,839 | $12,693 |
| Standard Deviation (Population) | $15,669 | $12,577 |
Similar Demographics by Median Male Earnings
Demographics Similar to Immigrants from Costa Rica by Median Male Earnings
In terms of median male earnings, the demographic groups most similar to Immigrants from Costa Rica are Tongan ($53,218, a difference of 0.030%), Immigrants from Kenya ($53,427, a difference of 0.36%), Immigrants from Africa ($53,457, a difference of 0.41%), Immigrants from the Azores ($53,503, a difference of 0.50%), and Immigrants from Thailand ($52,908, a difference of 0.62%).
| Demographics | Rating | Rank | Median Male Earnings |
| Guamanians/Chamorros | 30.7 /100 | #191 | Fair $53,661 |
| Scotch-Irish | 30.6 /100 | #192 | Fair $53,658 |
| Kenyans | 30.4 /100 | #193 | Fair $53,647 |
| Spanish | 29.0 /100 | #194 | Fair $53,576 |
| Immigrants | Azores | 27.5 /100 | #195 | Fair $53,503 |
| Immigrants | Africa | 26.6 /100 | #196 | Fair $53,457 |
| Immigrants | Kenya | 26.0 /100 | #197 | Fair $53,427 |
| Immigrants | Costa Rica | 22.6 /100 | #198 | Fair $53,237 |
| Tongans | 22.3 /100 | #199 | Fair $53,218 |
| Immigrants | Thailand | 17.5 /100 | #200 | Poor $52,908 |
| Immigrants | Bosnia and Herzegovina | 16.9 /100 | #201 | Poor $52,869 |
| Immigrants | Uruguay | 16.8 /100 | #202 | Poor $52,860 |
| Panamanians | 16.5 /100 | #203 | Poor $52,835 |
| Ghanaians | 16.1 /100 | #204 | Poor $52,810 |
| Immigrants | Colombia | 15.0 /100 | #205 | Poor $52,725 |
Demographics Similar to Immigrants from Sudan by Median Male Earnings
In terms of median male earnings, the demographic groups most similar to Immigrants from Sudan are Japanese ($51,473, a difference of 0.030%), Trinidadian and Tobagonian ($51,446, a difference of 0.080%), Samoan ($51,389, a difference of 0.19%), Immigrants from Cambodia ($51,594, a difference of 0.20%), and Ecuadorian ($51,596, a difference of 0.21%).
| Demographics | Rating | Rank | Median Male Earnings |
| Immigrants | Panama | 7.7 /100 | #218 | Tragic $51,962 |
| Immigrants | Ghana | 6.9 /100 | #219 | Tragic $51,836 |
| Immigrants | Armenia | 6.6 /100 | #220 | Tragic $51,793 |
| Immigrants | Senegal | 5.8 /100 | #221 | Tragic $51,647 |
| Immigrants | Bangladesh | 5.8 /100 | #222 | Tragic $51,642 |
| Ecuadorians | 5.5 /100 | #223 | Tragic $51,596 |
| Immigrants | Cambodia | 5.5 /100 | #224 | Tragic $51,594 |
| Immigrants | Sudan | 5.0 /100 | #225 | Tragic $51,489 |
| Japanese | 4.9 /100 | #226 | Tragic $51,473 |
| Trinidadians and Tobagonians | 4.8 /100 | #227 | Tragic $51,446 |
| Samoans | 4.6 /100 | #228 | Tragic $51,389 |
| Immigrants | Trinidad and Tobago | 4.5 /100 | #229 | Tragic $51,376 |
| Immigrants | Nigeria | 4.2 /100 | #230 | Tragic $51,310 |
| Barbadians | 3.9 /100 | #231 | Tragic $51,236 |
| Sudanese | 3.9 /100 | #232 | Tragic $51,216 |