Chippewa vs Immigrants from Cuba Divorced or Separated
COMPARE
Chippewa
Immigrants from Cuba
Divorced or Separated
Divorced or Separated Comparison
Chippewa
Immigrants from Cuba
13.2%
DIVORCED OR SEPARATED
0.0/ 100
METRIC RATING
305th/ 347
METRIC RANK
15.2%
DIVORCED OR SEPARATED
0.0/ 100
METRIC RATING
347th/ 347
METRIC RANK
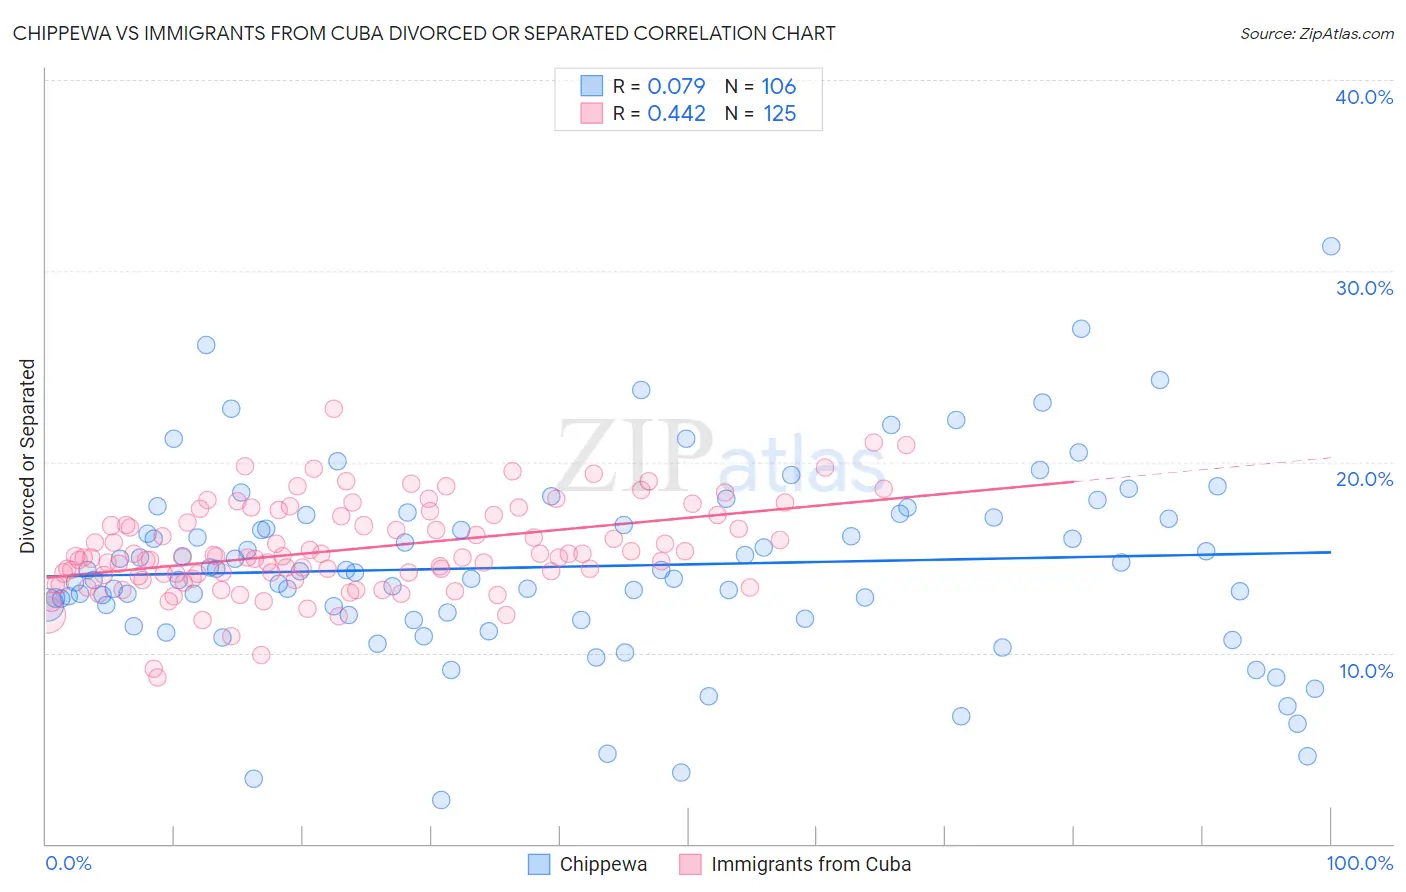
Chippewa vs Immigrants from Cuba Divorced or Separated Correlation Chart
The statistical analysis conducted on geographies consisting of 215,036,643 people shows a slight positive correlation between the proportion of Chippewa and percentage of population currently divorced or separated in the United States with a correlation coefficient (R) of 0.079 and weighted average of 13.2%. Similarly, the statistical analysis conducted on geographies consisting of 325,985,435 people shows a moderate positive correlation between the proportion of Immigrants from Cuba and percentage of population currently divorced or separated in the United States with a correlation coefficient (R) of 0.442 and weighted average of 15.2%, a difference of 15.7%.
Divorced or Separated Correlation Summary
| Measurement | Chippewa | Immigrants from Cuba |
| Minimum | 2.3% | 8.7% |
| Maximum | 31.3% | 22.8% |
| Range | 29.0% | 14.1% |
| Mean | 14.5% | 15.4% |
| Median | 14.2% | 15.0% |
| Interquartile 25% (IQ1) | 12.0% | 14.0% |
| Interquartile 75% (IQ3) | 17.1% | 17.2% |
| Interquartile Range (IQR) | 5.1% | 3.2% |
| Standard Deviation (Sample) | 4.9% | 2.4% |
| Standard Deviation (Population) | 4.9% | 2.4% |
Similar Demographics by Divorced or Separated
Demographics Similar to Chippewa by Divorced or Separated
In terms of divorced or separated, the demographic groups most similar to Chippewa are Hopi (13.2%, a difference of 0.050%), Tlingit-Haida (13.2%, a difference of 0.16%), Cape Verdean (13.1%, a difference of 0.18%), Immigrants from Venezuela (13.1%, a difference of 0.20%), and Alaskan Athabascan (13.1%, a difference of 0.30%).
| Demographics | Rating | Rank | Divorced or Separated |
| Venezuelans | 0.0 /100 | #298 | Tragic 13.0% |
| Immigrants | Jamaica | 0.0 /100 | #299 | Tragic 13.0% |
| Immigrants | Cabo Verde | 0.0 /100 | #300 | Tragic 13.1% |
| Alaskan Athabascans | 0.0 /100 | #301 | Tragic 13.1% |
| Immigrants | Venezuela | 0.0 /100 | #302 | Tragic 13.1% |
| Cape Verdeans | 0.0 /100 | #303 | Tragic 13.1% |
| Hopi | 0.0 /100 | #304 | Tragic 13.2% |
| Chippewa | 0.0 /100 | #305 | Tragic 13.2% |
| Tlingit-Haida | 0.0 /100 | #306 | Tragic 13.2% |
| French American Indians | 0.0 /100 | #307 | Tragic 13.2% |
| Ottawa | 0.0 /100 | #308 | Tragic 13.2% |
| Americans | 0.0 /100 | #309 | Tragic 13.2% |
| Africans | 0.0 /100 | #310 | Tragic 13.2% |
| Sioux | 0.0 /100 | #311 | Tragic 13.2% |
| Blackfeet | 0.0 /100 | #312 | Tragic 13.3% |
Demographics Similar to Immigrants from Cuba by Divorced or Separated
In terms of divorced or separated, the demographic groups most similar to Immigrants from Cuba are Arapaho (14.8%, a difference of 2.8%), Kiowa (14.5%, a difference of 4.9%), Cuban (14.5%, a difference of 5.0%), Creek (14.4%, a difference of 5.7%), and Seminole (14.3%, a difference of 6.8%).
| Demographics | Rating | Rank | Divorced or Separated |
| Puerto Ricans | 0.0 /100 | #333 | Tragic 13.9% |
| Immigrants | Bahamas | 0.0 /100 | #334 | Tragic 13.9% |
| Dutch West Indians | 0.0 /100 | #335 | Tragic 14.0% |
| Shoshone | 0.0 /100 | #336 | Tragic 14.0% |
| Crow | 0.0 /100 | #337 | Tragic 14.1% |
| Choctaw | 0.0 /100 | #338 | Tragic 14.1% |
| Colville | 0.0 /100 | #339 | Tragic 14.2% |
| Chickasaw | 0.0 /100 | #340 | Tragic 14.2% |
| Bahamians | 0.0 /100 | #341 | Tragic 14.2% |
| Seminole | 0.0 /100 | #342 | Tragic 14.3% |
| Creek | 0.0 /100 | #343 | Tragic 14.4% |
| Cubans | 0.0 /100 | #344 | Tragic 14.5% |
| Kiowa | 0.0 /100 | #345 | Tragic 14.5% |
| Arapaho | 0.0 /100 | #346 | Tragic 14.8% |
| Immigrants | Cuba | 0.0 /100 | #347 | Tragic 15.2% |