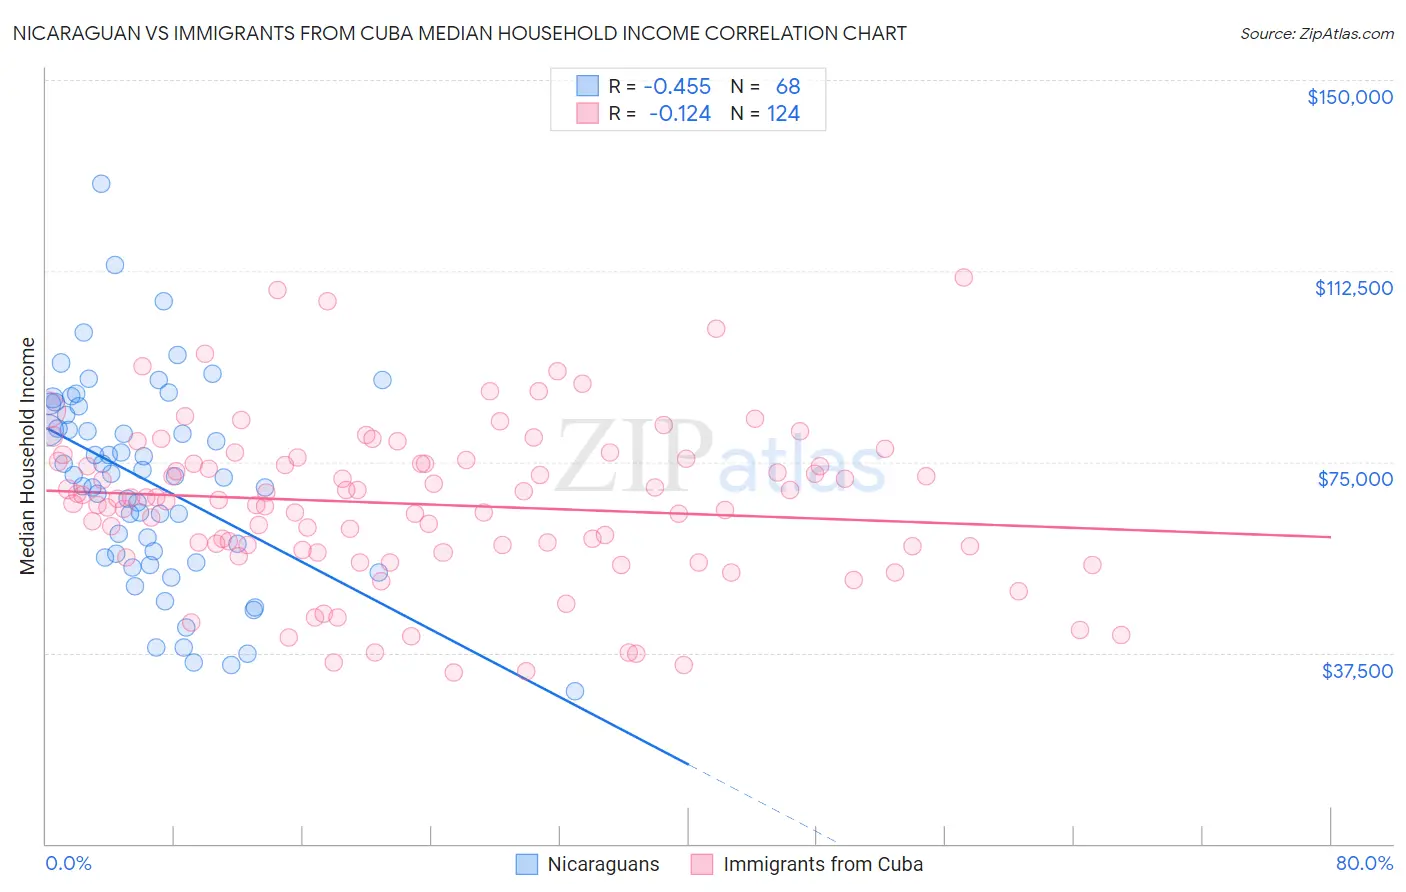
Nicaraguan vs Immigrants from Cuba Median Household Income
COMPARE
Nicaraguan
Immigrants from Cuba
Median Household Income
Median Household Income Comparison
Nicaraguans
Immigrants from Cuba
$79,737
MEDIAN HOUSEHOLD INCOME
3.1/ 100
METRIC RATING
237th/ 347
METRIC RANK
$68,461
MEDIAN HOUSEHOLD INCOME
0.0/ 100
METRIC RATING
327th/ 347
METRIC RANK
Nicaraguan vs Immigrants from Cuba Median Household Income Correlation Chart
The statistical analysis conducted on geographies consisting of 285,567,751 people shows a moderate negative correlation between the proportion of Nicaraguans and median household income in the United States with a correlation coefficient (R) of -0.455 and weighted average of $79,737. Similarly, the statistical analysis conducted on geographies consisting of 325,902,946 people shows a poor negative correlation between the proportion of Immigrants from Cuba and median household income in the United States with a correlation coefficient (R) of -0.124 and weighted average of $68,461, a difference of 16.5%.
Median Household Income Correlation Summary
| Measurement | Nicaraguan | Immigrants from Cuba |
| Minimum | $29,878 | $33,697 |
| Maximum | $129,595 | $111,328 |
| Range | $99,717 | $77,631 |
| Mean | $70,971 | $66,701 |
| Median | $72,218 | $67,566 |
| Interquartile 25% (IQ1) | $56,639 | $57,982 |
| Interquartile 75% (IQ3) | $85,047 | $75,238 |
| Interquartile Range (IQR) | $28,408 | $17,257 |
| Standard Deviation (Sample) | $19,770 | $15,525 |
| Standard Deviation (Population) | $19,624 | $15,462 |
Similar Demographics by Median Household Income
Demographics Similar to Nicaraguans by Median Household Income
In terms of median household income, the demographic groups most similar to Nicaraguans are Barbadian ($79,664, a difference of 0.090%), Immigrants from Bosnia and Herzegovina ($79,888, a difference of 0.19%), Alaska Native ($79,509, a difference of 0.29%), Immigrants from Western Africa ($79,490, a difference of 0.31%), and Nonimmigrants ($79,429, a difference of 0.39%).
| Demographics | Rating | Rank | Median Household Income |
| Bermudans | 4.7 /100 | #230 | Tragic $80,406 |
| Trinidadians and Tobagonians | 4.7 /100 | #231 | Tragic $80,402 |
| Immigrants | Trinidad and Tobago | 4.6 /100 | #232 | Tragic $80,373 |
| Immigrants | Azores | 4.5 /100 | #233 | Tragic $80,357 |
| Immigrants | Ecuador | 4.5 /100 | #234 | Tragic $80,341 |
| Immigrants | Guyana | 4.5 /100 | #235 | Tragic $80,324 |
| Immigrants | Bosnia and Herzegovina | 3.4 /100 | #236 | Tragic $79,888 |
| Nicaraguans | 3.1 /100 | #237 | Tragic $79,737 |
| Barbadians | 3.0 /100 | #238 | Tragic $79,664 |
| Alaska Natives | 2.7 /100 | #239 | Tragic $79,509 |
| Immigrants | Western Africa | 2.7 /100 | #240 | Tragic $79,490 |
| Immigrants | Nonimmigrants | 2.6 /100 | #241 | Tragic $79,429 |
| Immigrants | Sudan | 2.1 /100 | #242 | Tragic $79,103 |
| Immigrants | Barbados | 1.9 /100 | #243 | Tragic $78,989 |
| Marshallese | 1.9 /100 | #244 | Tragic $78,930 |
Demographics Similar to Immigrants from Cuba by Median Household Income
In terms of median household income, the demographic groups most similar to Immigrants from Cuba are Menominee ($68,423, a difference of 0.060%), Dutch West Indian ($68,412, a difference of 0.070%), Yuman ($68,743, a difference of 0.41%), Arapaho ($67,965, a difference of 0.73%), and Native/Alaskan ($67,879, a difference of 0.86%).
| Demographics | Rating | Rank | Median Household Income |
| Colville | 0.0 /100 | #320 | Tragic $70,094 |
| Chickasaw | 0.0 /100 | #321 | Tragic $70,005 |
| Choctaw | 0.0 /100 | #322 | Tragic $69,947 |
| Bahamians | 0.0 /100 | #323 | Tragic $69,726 |
| Yup'ik | 0.0 /100 | #324 | Tragic $69,695 |
| Seminole | 0.0 /100 | #325 | Tragic $69,420 |
| Yuman | 0.0 /100 | #326 | Tragic $68,743 |
| Immigrants | Cuba | 0.0 /100 | #327 | Tragic $68,461 |
| Menominee | 0.0 /100 | #328 | Tragic $68,423 |
| Dutch West Indians | 0.0 /100 | #329 | Tragic $68,412 |
| Arapaho | 0.0 /100 | #330 | Tragic $67,965 |
| Natives/Alaskans | 0.0 /100 | #331 | Tragic $67,879 |
| Sioux | 0.0 /100 | #332 | Tragic $67,792 |
| Creek | 0.0 /100 | #333 | Tragic $67,715 |
| Blacks/African Americans | 0.0 /100 | #334 | Tragic $67,573 |