Chippewa vs Immigrants from Cuba Householder Income Ages 45 - 64 years
COMPARE
Chippewa
Immigrants from Cuba
Householder Income Ages 45 - 64 years
Householder Income Ages 45 - 64 years Comparison
Chippewa
Immigrants from Cuba
$83,943
HOUSEHOLDER INCOME AGES 45 - 64 YEARS
0.0/ 100
METRIC RATING
305th/ 347
METRIC RANK
$80,662
HOUSEHOLDER INCOME AGES 45 - 64 YEARS
0.0/ 100
METRIC RATING
325th/ 347
METRIC RANK
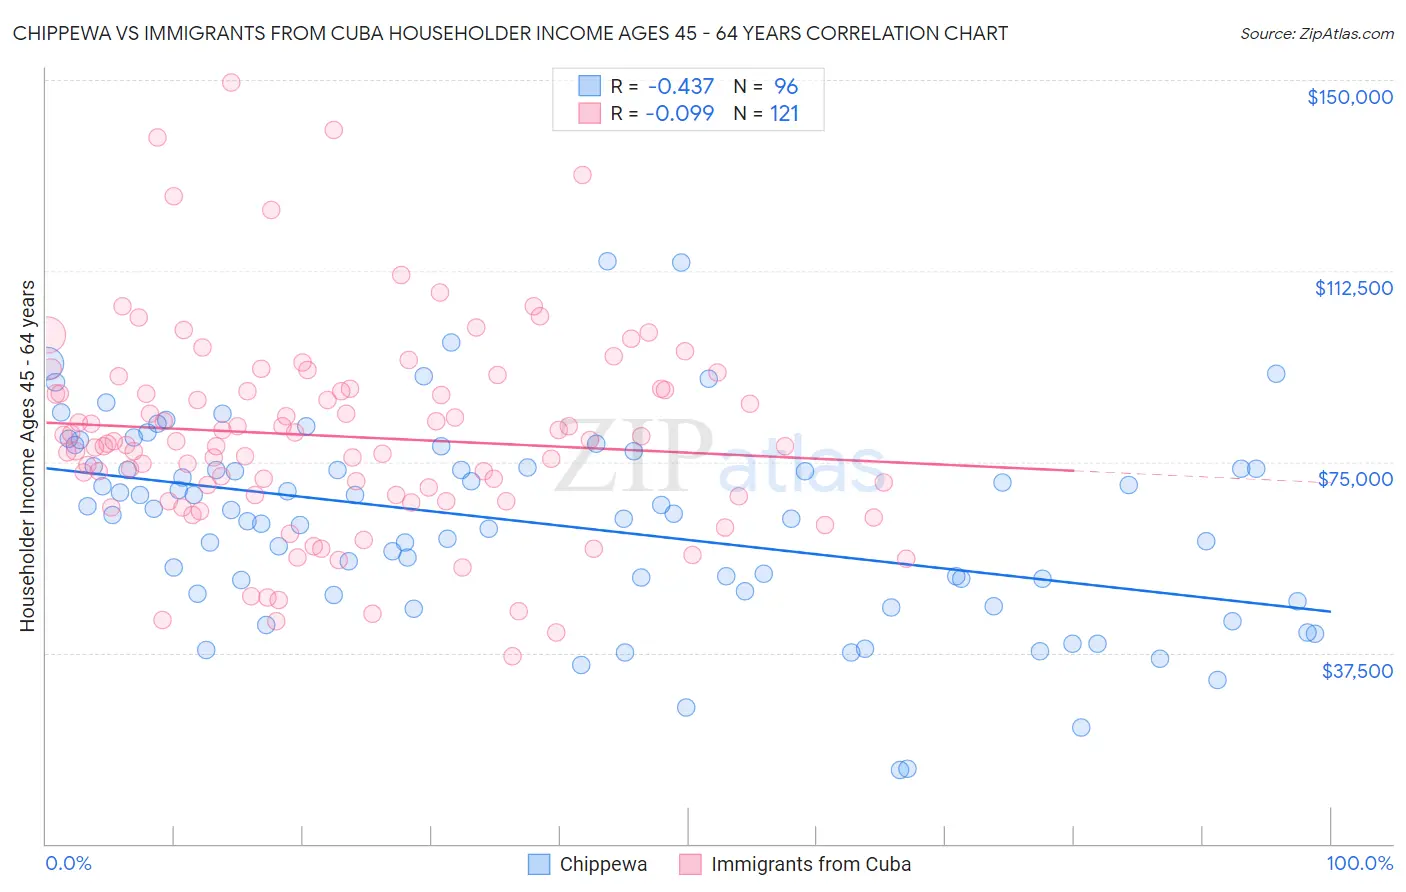
Chippewa vs Immigrants from Cuba Householder Income Ages 45 - 64 years Correlation Chart
The statistical analysis conducted on geographies consisting of 214,822,220 people shows a moderate negative correlation between the proportion of Chippewa and household income with householder between the ages 45 and 64 in the United States with a correlation coefficient (R) of -0.437 and weighted average of $83,943. Similarly, the statistical analysis conducted on geographies consisting of 325,648,995 people shows a slight negative correlation between the proportion of Immigrants from Cuba and household income with householder between the ages 45 and 64 in the United States with a correlation coefficient (R) of -0.099 and weighted average of $80,662, a difference of 4.1%.
Householder Income Ages 45 - 64 years Correlation Summary
| Measurement | Chippewa | Immigrants from Cuba |
| Minimum | $14,500 | $36,806 |
| Maximum | $114,293 | $149,489 |
| Range | $99,793 | $112,683 |
| Mean | $62,889 | $79,969 |
| Median | $64,689 | $78,597 |
| Interquartile 25% (IQ1) | $49,307 | $67,753 |
| Interquartile 75% (IQ3) | $73,755 | $89,231 |
| Interquartile Range (IQR) | $24,448 | $21,478 |
| Standard Deviation (Sample) | $19,427 | $20,104 |
| Standard Deviation (Population) | $19,326 | $20,021 |
Demographics Similar to Chippewa and Immigrants from Cuba by Householder Income Ages 45 - 64 years
In terms of householder income ages 45 - 64 years, the demographic groups most similar to Chippewa are Ute ($83,937, a difference of 0.010%), Shoshone ($83,588, a difference of 0.43%), Immigrants from Cabo Verde ($83,542, a difference of 0.48%), Immigrants from Dominica ($83,311, a difference of 0.76%), and Immigrants from Haiti ($83,257, a difference of 0.82%). Similarly, the demographic groups most similar to Immigrants from Cuba are Yup'ik ($81,000, a difference of 0.42%), Bahamian ($81,369, a difference of 0.88%), Sioux ($81,750, a difference of 1.3%), Yuman ($82,139, a difference of 1.8%), and Apache ($82,184, a difference of 1.9%).
| Demographics | Rating | Rank | Householder Income Ages 45 - 64 years |
| Chippewa | 0.0 /100 | #305 | Tragic $83,943 |
| Ute | 0.0 /100 | #306 | Tragic $83,937 |
| Shoshone | 0.0 /100 | #307 | Tragic $83,588 |
| Immigrants | Cabo Verde | 0.0 /100 | #308 | Tragic $83,542 |
| Immigrants | Dominica | 0.0 /100 | #309 | Tragic $83,311 |
| Immigrants | Haiti | 0.0 /100 | #310 | Tragic $83,257 |
| Immigrants | Bahamas | 0.0 /100 | #311 | Tragic $83,177 |
| Cajuns | 0.0 /100 | #312 | Tragic $83,015 |
| U.S. Virgin Islanders | 0.0 /100 | #313 | Tragic $82,736 |
| Immigrants | Honduras | 0.0 /100 | #314 | Tragic $82,697 |
| Paiute | 0.0 /100 | #315 | Tragic $82,629 |
| Immigrants | Caribbean | 0.0 /100 | #316 | Tragic $82,513 |
| Colville | 0.0 /100 | #317 | Tragic $82,474 |
| Choctaw | 0.0 /100 | #318 | Tragic $82,287 |
| Chickasaw | 0.0 /100 | #319 | Tragic $82,193 |
| Apache | 0.0 /100 | #320 | Tragic $82,184 |
| Yuman | 0.0 /100 | #321 | Tragic $82,139 |
| Sioux | 0.0 /100 | #322 | Tragic $81,750 |
| Bahamians | 0.0 /100 | #323 | Tragic $81,369 |
| Yup'ik | 0.0 /100 | #324 | Tragic $81,000 |
| Immigrants | Cuba | 0.0 /100 | #325 | Tragic $80,662 |