Czech vs Puerto Rican Median Female Earnings
COMPARE
Czech
Puerto Rican
Median Female Earnings
Median Female Earnings Comparison
Czechs
Puerto Ricans
$38,992
MEDIAN FEMALE EARNINGS
18.7/ 100
METRIC RATING
203rd/ 347
METRIC RANK
$31,560
MEDIAN FEMALE EARNINGS
0.0/ 100
METRIC RATING
345th/ 347
METRIC RANK
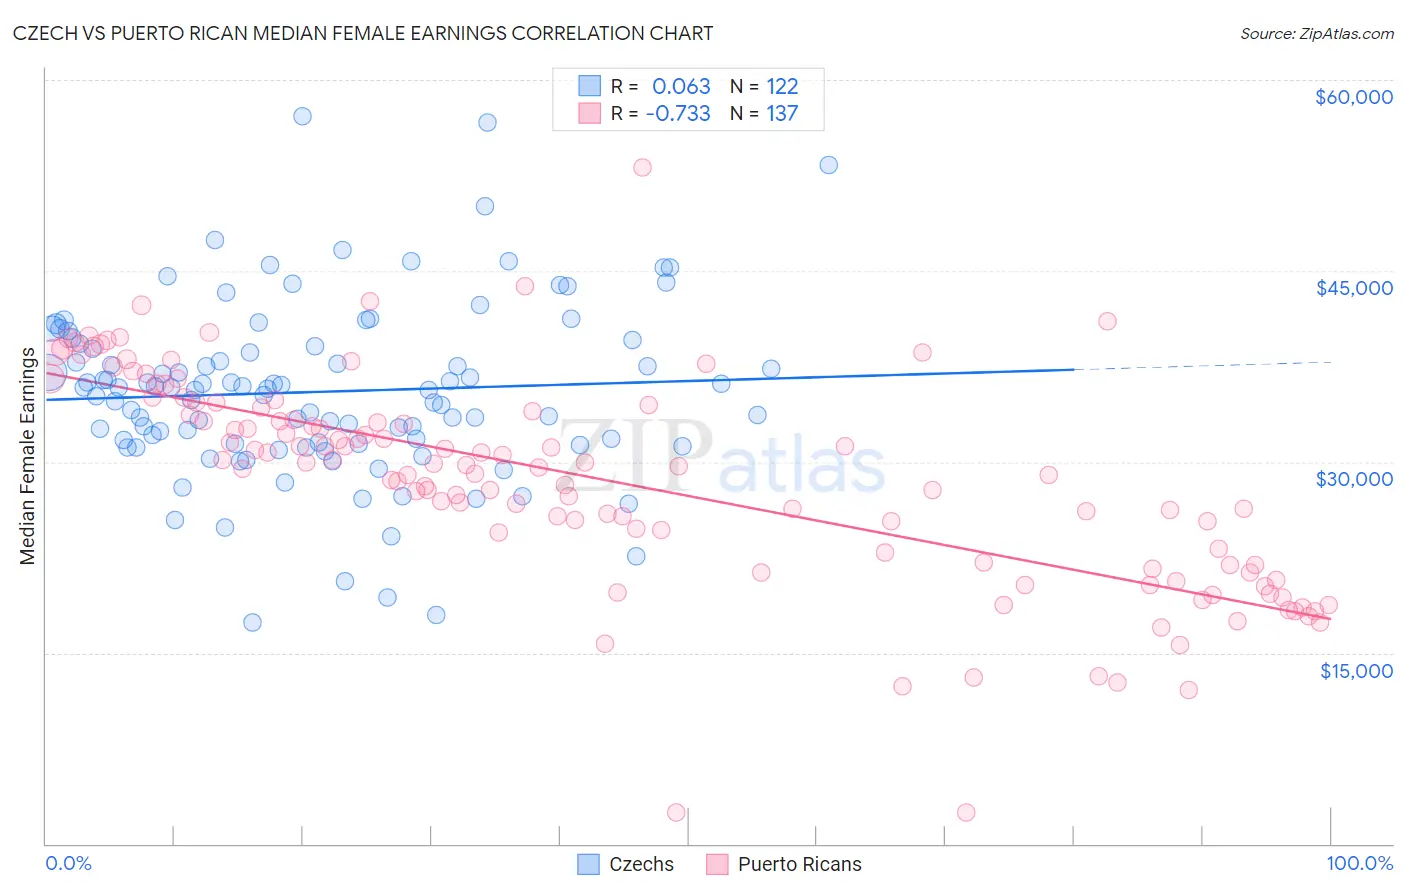
Czech vs Puerto Rican Median Female Earnings Correlation Chart
The statistical analysis conducted on geographies consisting of 484,306,761 people shows a slight positive correlation between the proportion of Czechs and median female earnings in the United States with a correlation coefficient (R) of 0.063 and weighted average of $38,992. Similarly, the statistical analysis conducted on geographies consisting of 527,573,367 people shows a strong negative correlation between the proportion of Puerto Ricans and median female earnings in the United States with a correlation coefficient (R) of -0.733 and weighted average of $31,560, a difference of 23.5%.
Median Female Earnings Correlation Summary
| Measurement | Czech | Puerto Rican |
| Minimum | $17,404 | $2,499 |
| Maximum | $57,188 | $53,092 |
| Range | $39,784 | $50,593 |
| Mean | $35,507 | $28,571 |
| Median | $35,690 | $29,640 |
| Interquartile 25% (IQ1) | $31,400 | $21,994 |
| Interquartile 75% (IQ3) | $39,083 | $34,369 |
| Interquartile Range (IQR) | $7,683 | $12,375 |
| Standard Deviation (Sample) | $6,872 | $8,353 |
| Standard Deviation (Population) | $6,843 | $8,323 |
Similar Demographics by Median Female Earnings
Demographics Similar to Czechs by Median Female Earnings
In terms of median female earnings, the demographic groups most similar to Czechs are Slovak ($39,029, a difference of 0.090%), Immigrants from Uruguay ($38,945, a difference of 0.12%), Immigrants from Panama ($39,049, a difference of 0.15%), Panamanian ($39,049, a difference of 0.15%), and Immigrants from Colombia ($38,913, a difference of 0.20%).
| Demographics | Rating | Rank | Median Female Earnings |
| Immigrants | Costa Rica | 25.6 /100 | #196 | Fair $39,186 |
| Assyrians/Chaldeans/Syriacs | 24.6 /100 | #197 | Fair $39,159 |
| Ecuadorians | 23.0 /100 | #198 | Fair $39,117 |
| Icelanders | 22.7 /100 | #199 | Fair $39,109 |
| Immigrants | Panama | 20.6 /100 | #200 | Fair $39,049 |
| Panamanians | 20.6 /100 | #201 | Fair $39,049 |
| Slovaks | 19.9 /100 | #202 | Poor $39,029 |
| Czechs | 18.7 /100 | #203 | Poor $38,992 |
| Immigrants | Uruguay | 17.3 /100 | #204 | Poor $38,945 |
| Immigrants | Colombia | 16.3 /100 | #205 | Poor $38,913 |
| Immigrants | Bosnia and Herzegovina | 15.6 /100 | #206 | Poor $38,886 |
| Immigrants | Cambodia | 14.2 /100 | #207 | Poor $38,833 |
| Immigrants | Thailand | 13.6 /100 | #208 | Poor $38,810 |
| Norwegians | 13.4 /100 | #209 | Poor $38,802 |
| Czechoslovakians | 12.0 /100 | #210 | Poor $38,738 |
Demographics Similar to Puerto Ricans by Median Female Earnings
In terms of median female earnings, the demographic groups most similar to Puerto Ricans are Arapaho ($31,489, a difference of 0.23%), Lumbee ($32,500, a difference of 3.0%), Pueblo ($32,564, a difference of 3.2%), Yup'ik ($32,730, a difference of 3.7%), and Houma ($30,343, a difference of 4.0%).
| Demographics | Rating | Rank | Median Female Earnings |
| Mexicans | 0.0 /100 | #333 | Tragic $33,664 |
| Spanish American Indians | 0.0 /100 | #334 | Tragic $33,625 |
| Creek | 0.0 /100 | #335 | Tragic $33,437 |
| Ottawa | 0.0 /100 | #336 | Tragic $33,378 |
| Yakama | 0.0 /100 | #337 | Tragic $33,354 |
| Immigrants | Cuba | 0.0 /100 | #338 | Tragic $33,291 |
| Immigrants | Mexico | 0.0 /100 | #339 | Tragic $33,236 |
| Tohono O'odham | 0.0 /100 | #340 | Tragic $33,205 |
| Navajo | 0.0 /100 | #341 | Tragic $33,046 |
| Yup'ik | 0.0 /100 | #342 | Tragic $32,730 |
| Pueblo | 0.0 /100 | #343 | Tragic $32,564 |
| Lumbee | 0.0 /100 | #344 | Tragic $32,500 |
| Puerto Ricans | 0.0 /100 | #345 | Tragic $31,560 |
| Arapaho | 0.0 /100 | #346 | Tragic $31,489 |
| Houma | 0.0 /100 | #347 | Tragic $30,343 |