Immigrants from Eastern Europe vs Puerto Rican Median Female Earnings
COMPARE
Immigrants from Eastern Europe
Puerto Rican
Median Female Earnings
Median Female Earnings Comparison
Immigrants from Eastern Europe
Puerto Ricans
$43,309
MEDIAN FEMALE EARNINGS
99.9/ 100
METRIC RATING
53rd/ 347
METRIC RANK
$31,560
MEDIAN FEMALE EARNINGS
0.0/ 100
METRIC RATING
345th/ 347
METRIC RANK
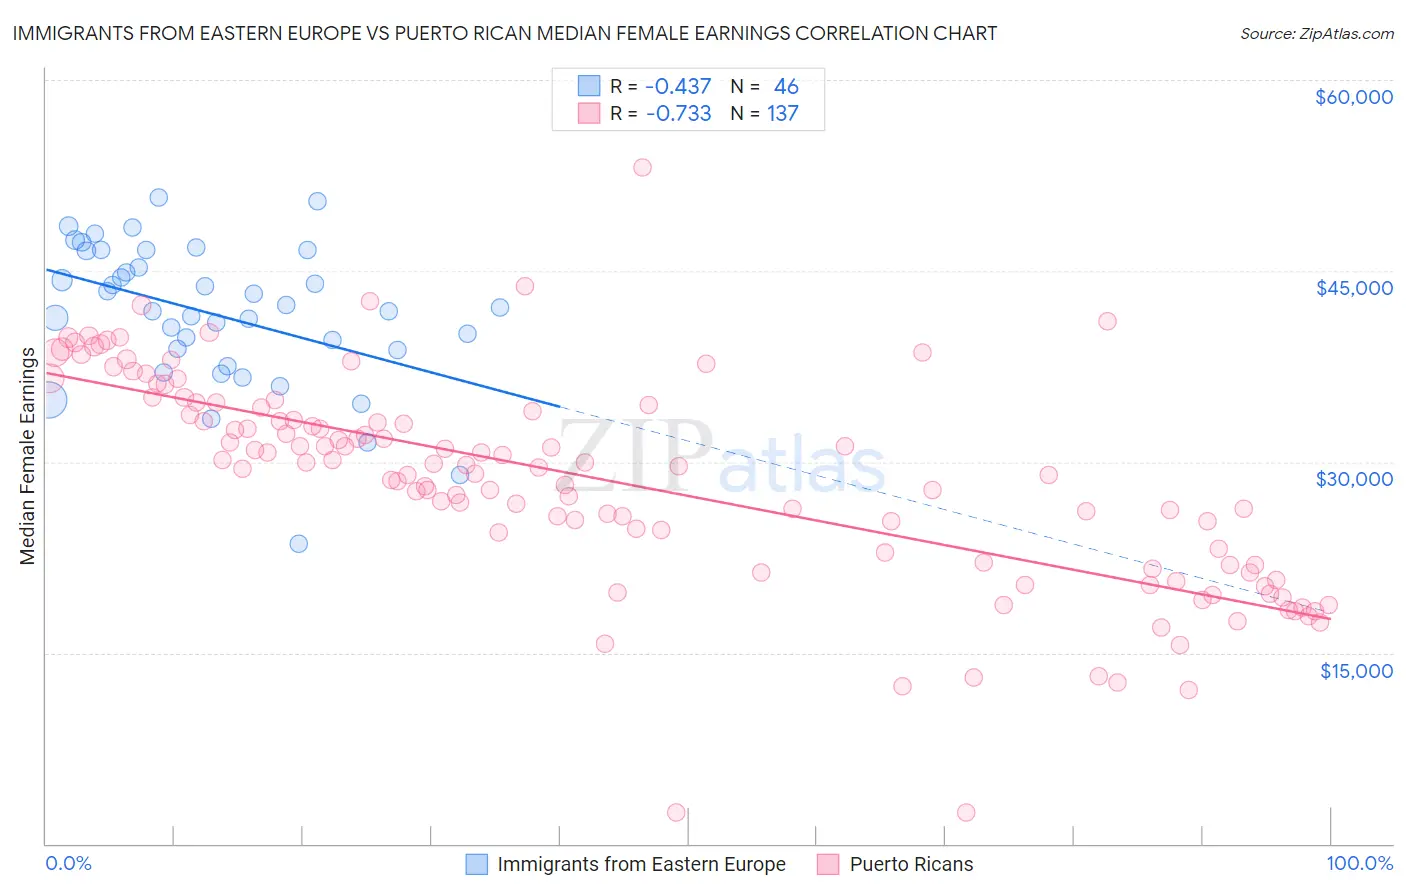
Immigrants from Eastern Europe vs Puerto Rican Median Female Earnings Correlation Chart
The statistical analysis conducted on geographies consisting of 475,519,051 people shows a moderate negative correlation between the proportion of Immigrants from Eastern Europe and median female earnings in the United States with a correlation coefficient (R) of -0.437 and weighted average of $43,309. Similarly, the statistical analysis conducted on geographies consisting of 527,573,367 people shows a strong negative correlation between the proportion of Puerto Ricans and median female earnings in the United States with a correlation coefficient (R) of -0.733 and weighted average of $31,560, a difference of 37.2%.
Median Female Earnings Correlation Summary
| Measurement | Immigrants from Eastern Europe | Puerto Rican |
| Minimum | $23,547 | $2,499 |
| Maximum | $50,763 | $53,092 |
| Range | $27,216 | $50,593 |
| Mean | $41,579 | $28,571 |
| Median | $41,989 | $29,640 |
| Interquartile 25% (IQ1) | $38,750 | $21,994 |
| Interquartile 75% (IQ3) | $46,583 | $34,369 |
| Interquartile Range (IQR) | $7,833 | $12,375 |
| Standard Deviation (Sample) | $5,669 | $8,353 |
| Standard Deviation (Population) | $5,607 | $8,323 |
Similar Demographics by Median Female Earnings
Demographics Similar to Immigrants from Eastern Europe by Median Female Earnings
In terms of median female earnings, the demographic groups most similar to Immigrants from Eastern Europe are Australian ($43,308, a difference of 0.0%), Egyptian ($43,305, a difference of 0.010%), Immigrants from Lithuania ($43,317, a difference of 0.020%), Maltese ($43,357, a difference of 0.11%), and Immigrants from Uzbekistan ($43,363, a difference of 0.12%).
| Demographics | Rating | Rank | Median Female Earnings |
| Immigrants | Bolivia | 100.0 /100 | #46 | Exceptional $43,467 |
| Bolivians | 100.0 /100 | #47 | Exceptional $43,445 |
| Immigrants | Indonesia | 100.0 /100 | #48 | Exceptional $43,412 |
| Immigrants | Serbia | 100.0 /100 | #49 | Exceptional $43,385 |
| Immigrants | Uzbekistan | 100.0 /100 | #50 | Exceptional $43,363 |
| Maltese | 100.0 /100 | #51 | Exceptional $43,357 |
| Immigrants | Lithuania | 99.9 /100 | #52 | Exceptional $43,317 |
| Immigrants | Eastern Europe | 99.9 /100 | #53 | Exceptional $43,309 |
| Australians | 99.9 /100 | #54 | Exceptional $43,308 |
| Egyptians | 99.9 /100 | #55 | Exceptional $43,305 |
| Immigrants | Croatia | 99.9 /100 | #56 | Exceptional $43,258 |
| Ethiopians | 99.9 /100 | #57 | Exceptional $43,243 |
| Paraguayans | 99.9 /100 | #58 | Exceptional $43,173 |
| Estonians | 99.9 /100 | #59 | Exceptional $43,106 |
| Immigrants | Latvia | 99.9 /100 | #60 | Exceptional $43,099 |
Demographics Similar to Puerto Ricans by Median Female Earnings
In terms of median female earnings, the demographic groups most similar to Puerto Ricans are Arapaho ($31,489, a difference of 0.23%), Lumbee ($32,500, a difference of 3.0%), Pueblo ($32,564, a difference of 3.2%), Yup'ik ($32,730, a difference of 3.7%), and Houma ($30,343, a difference of 4.0%).
| Demographics | Rating | Rank | Median Female Earnings |
| Mexicans | 0.0 /100 | #333 | Tragic $33,664 |
| Spanish American Indians | 0.0 /100 | #334 | Tragic $33,625 |
| Creek | 0.0 /100 | #335 | Tragic $33,437 |
| Ottawa | 0.0 /100 | #336 | Tragic $33,378 |
| Yakama | 0.0 /100 | #337 | Tragic $33,354 |
| Immigrants | Cuba | 0.0 /100 | #338 | Tragic $33,291 |
| Immigrants | Mexico | 0.0 /100 | #339 | Tragic $33,236 |
| Tohono O'odham | 0.0 /100 | #340 | Tragic $33,205 |
| Navajo | 0.0 /100 | #341 | Tragic $33,046 |
| Yup'ik | 0.0 /100 | #342 | Tragic $32,730 |
| Pueblo | 0.0 /100 | #343 | Tragic $32,564 |
| Lumbee | 0.0 /100 | #344 | Tragic $32,500 |
| Puerto Ricans | 0.0 /100 | #345 | Tragic $31,560 |
| Arapaho | 0.0 /100 | #346 | Tragic $31,489 |
| Houma | 0.0 /100 | #347 | Tragic $30,343 |