Central American Indian vs Shoshone Median Household Income
COMPARE
Central American Indian
Shoshone
Median Household Income
Median Household Income Comparison
Central American Indians
Shoshone
$74,847
MEDIAN HOUSEHOLD INCOME
0.1/ 100
METRIC RATING
282nd/ 347
METRIC RANK
$72,660
MEDIAN HOUSEHOLD INCOME
0.0/ 100
METRIC RATING
302nd/ 347
METRIC RANK
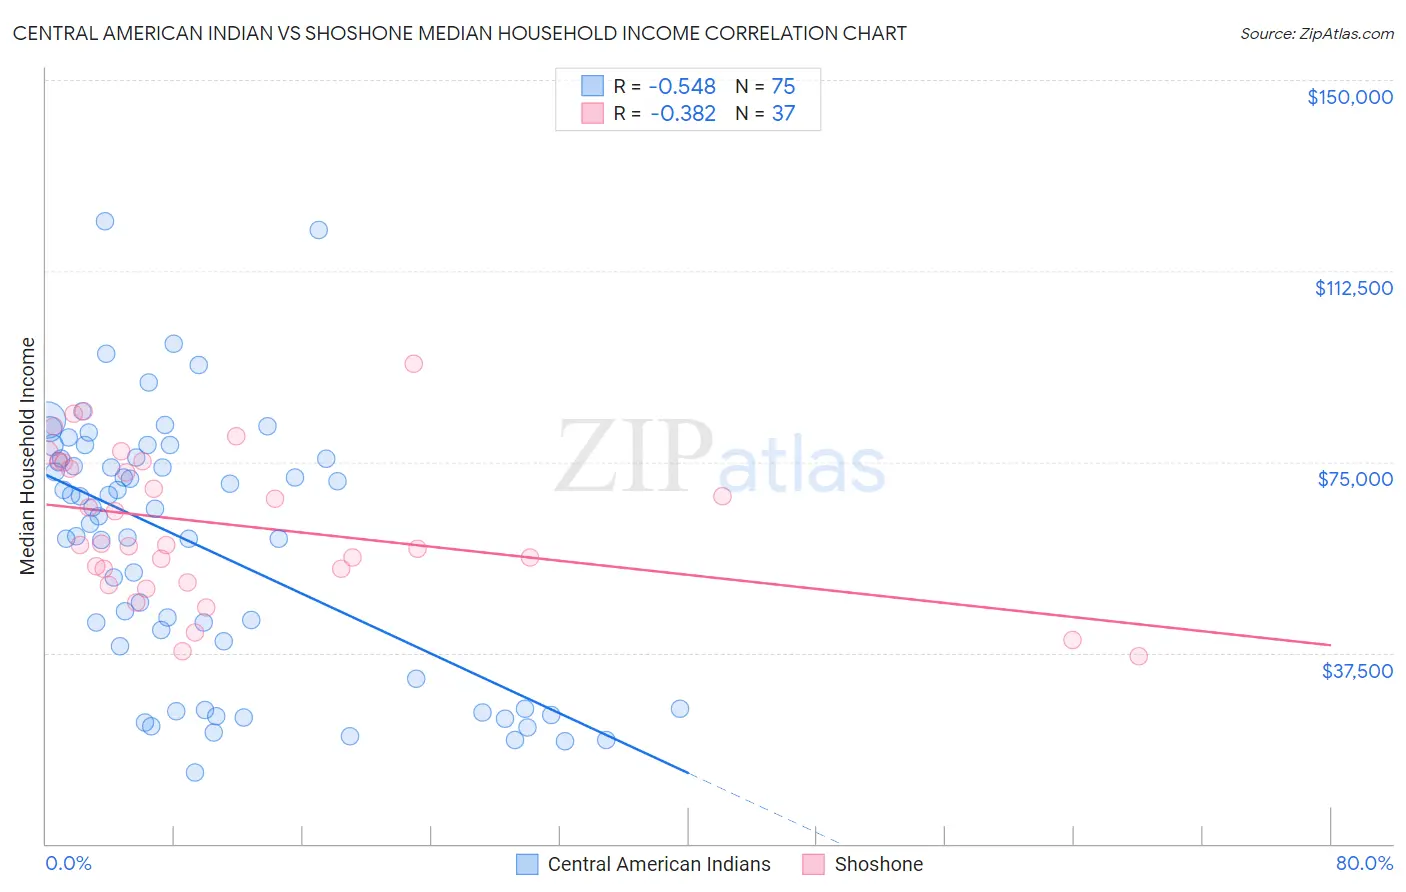
Central American Indian vs Shoshone Median Household Income Correlation Chart
The statistical analysis conducted on geographies consisting of 326,011,842 people shows a substantial negative correlation between the proportion of Central American Indians and median household income in the United States with a correlation coefficient (R) of -0.548 and weighted average of $74,847. Similarly, the statistical analysis conducted on geographies consisting of 66,612,449 people shows a mild negative correlation between the proportion of Shoshone and median household income in the United States with a correlation coefficient (R) of -0.382 and weighted average of $72,660, a difference of 3.0%.
Median Household Income Correlation Summary
| Measurement | Central American Indian | Shoshone |
| Minimum | $14,073 | $36,823 |
| Maximum | $122,237 | $94,375 |
| Range | $108,164 | $57,552 |
| Mean | $58,298 | $62,559 |
| Median | $64,310 | $58,750 |
| Interquartile 25% (IQ1) | $32,456 | $52,629 |
| Interquartile 75% (IQ3) | $75,688 | $75,002 |
| Interquartile Range (IQR) | $43,232 | $22,372 |
| Standard Deviation (Sample) | $25,417 | $14,416 |
| Standard Deviation (Population) | $25,247 | $14,219 |
Demographics Similar to Central American Indians and Shoshone by Median Household Income
In terms of median household income, the demographic groups most similar to Central American Indians are Cree ($74,685, a difference of 0.22%), Yaqui ($74,596, a difference of 0.34%), Mexican ($74,399, a difference of 0.60%), Immigrants from Somalia ($74,300, a difference of 0.74%), and Iroquois ($74,279, a difference of 0.76%). Similarly, the demographic groups most similar to Shoshone are Cherokee ($72,682, a difference of 0.030%), Immigrants from Dominica ($72,760, a difference of 0.14%), Indonesian ($72,856, a difference of 0.27%), Paiute ($72,959, a difference of 0.41%), and Immigrants from Mexico ($73,160, a difference of 0.69%).
| Demographics | Rating | Rank | Median Household Income |
| Central American Indians | 0.1 /100 | #282 | Tragic $74,847 |
| Cree | 0.1 /100 | #283 | Tragic $74,685 |
| Yaqui | 0.1 /100 | #284 | Tragic $74,596 |
| Mexicans | 0.1 /100 | #285 | Tragic $74,399 |
| Immigrants | Somalia | 0.1 /100 | #286 | Tragic $74,300 |
| Iroquois | 0.1 /100 | #287 | Tragic $74,279 |
| Immigrants | Central America | 0.1 /100 | #288 | Tragic $74,217 |
| Fijians | 0.1 /100 | #289 | Tragic $74,205 |
| Bangladeshis | 0.1 /100 | #290 | Tragic $74,112 |
| Hispanics or Latinos | 0.1 /100 | #291 | Tragic $73,823 |
| Comanche | 0.1 /100 | #292 | Tragic $73,747 |
| Immigrants | Cabo Verde | 0.1 /100 | #293 | Tragic $73,515 |
| Blackfeet | 0.1 /100 | #294 | Tragic $73,509 |
| Cubans | 0.1 /100 | #295 | Tragic $73,392 |
| Haitians | 0.1 /100 | #296 | Tragic $73,306 |
| Immigrants | Mexico | 0.0 /100 | #297 | Tragic $73,160 |
| Paiute | 0.0 /100 | #298 | Tragic $72,959 |
| Indonesians | 0.0 /100 | #299 | Tragic $72,856 |
| Immigrants | Dominica | 0.0 /100 | #300 | Tragic $72,760 |
| Cherokee | 0.0 /100 | #301 | Tragic $72,682 |
| Shoshone | 0.0 /100 | #302 | Tragic $72,660 |