Cherokee vs Shoshone GED/Equivalency
COMPARE
Cherokee
Shoshone
GED/Equivalency
GED/Equivalency Comparison
Cherokee
Shoshone
83.9%
GED/EQUIVALENCY
1.3/ 100
METRIC RATING
243rd/ 347
METRIC RANK
83.7%
GED/EQUIVALENCY
1.0/ 100
METRIC RATING
250th/ 347
METRIC RANK
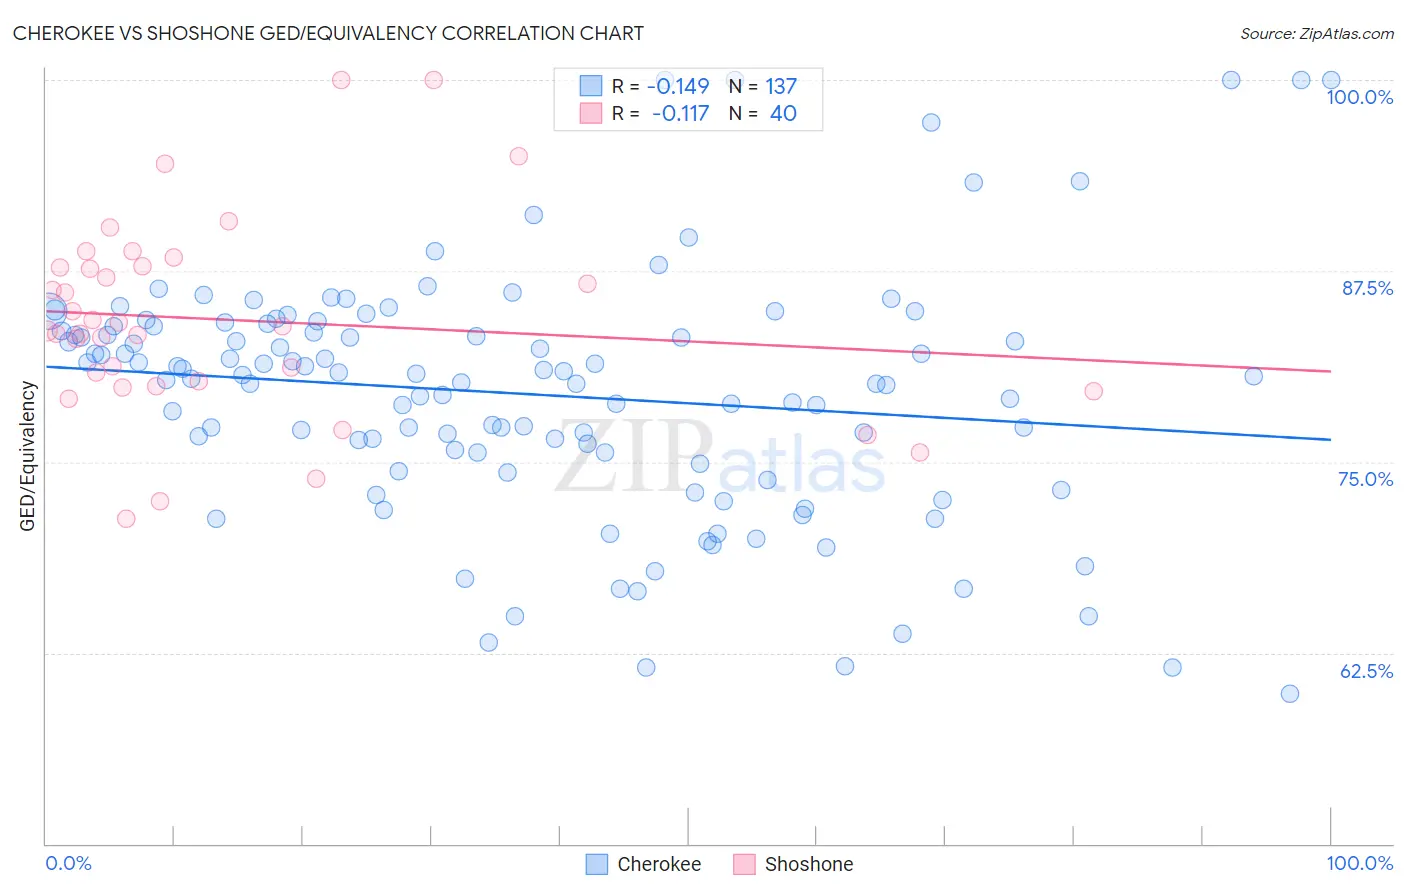
Cherokee vs Shoshone GED/Equivalency Correlation Chart
The statistical analysis conducted on geographies consisting of 493,719,798 people shows a poor negative correlation between the proportion of Cherokee and percentage of population with at least ged/equivalency education in the United States with a correlation coefficient (R) of -0.149 and weighted average of 83.9%. Similarly, the statistical analysis conducted on geographies consisting of 66,627,351 people shows a poor negative correlation between the proportion of Shoshone and percentage of population with at least ged/equivalency education in the United States with a correlation coefficient (R) of -0.117 and weighted average of 83.7%, a difference of 0.14%.
GED/Equivalency Correlation Summary
| Measurement | Cherokee | Shoshone |
| Minimum | 59.8% | 71.3% |
| Maximum | 100.0% | 100.0% |
| Range | 40.2% | 28.7% |
| Mean | 79.4% | 84.3% |
| Median | 80.6% | 83.7% |
| Interquartile 25% (IQ1) | 75.2% | 80.1% |
| Interquartile 75% (IQ3) | 83.9% | 87.8% |
| Interquartile Range (IQR) | 8.6% | 7.7% |
| Standard Deviation (Sample) | 8.0% | 6.5% |
| Standard Deviation (Population) | 8.0% | 6.4% |
Demographics Similar to Cherokee and Shoshone by GED/Equivalency
In terms of ged/equivalency, the demographic groups most similar to Cherokee are Immigrants from Ghana (83.9%, a difference of 0.010%), Immigrants from Senegal (83.8%, a difference of 0.040%), Chickasaw (83.8%, a difference of 0.060%), Immigrants from Western Africa (83.8%, a difference of 0.10%), and Blackfeet (83.8%, a difference of 0.11%). Similarly, the demographic groups most similar to Shoshone are Blackfeet (83.8%, a difference of 0.020%), Crow (83.8%, a difference of 0.020%), Immigrants from Western Africa (83.8%, a difference of 0.040%), Chickasaw (83.8%, a difference of 0.070%), and Immigrants from Senegal (83.8%, a difference of 0.090%).
| Demographics | Rating | Rank | GED/Equivalency |
| Immigrants | Eritrea | 3.5 /100 | #236 | Tragic 84.3% |
| Sub-Saharan Africans | 3.0 /100 | #237 | Tragic 84.2% |
| Immigrants | Peru | 2.7 /100 | #238 | Tragic 84.2% |
| Immigrants | Bahamas | 2.6 /100 | #239 | Tragic 84.2% |
| Immigrants | South Eastern Asia | 2.5 /100 | #240 | Tragic 84.1% |
| Senegalese | 1.9 /100 | #241 | Tragic 84.0% |
| Sri Lankans | 1.9 /100 | #242 | Tragic 84.0% |
| Cherokee | 1.3 /100 | #243 | Tragic 83.9% |
| Immigrants | Ghana | 1.3 /100 | #244 | Tragic 83.9% |
| Immigrants | Senegal | 1.2 /100 | #245 | Tragic 83.8% |
| Chickasaw | 1.2 /100 | #246 | Tragic 83.8% |
| Immigrants | Western Africa | 1.1 /100 | #247 | Tragic 83.8% |
| Blackfeet | 1.1 /100 | #248 | Tragic 83.8% |
| Crow | 1.1 /100 | #249 | Tragic 83.8% |
| Shoshone | 1.0 /100 | #250 | Tragic 83.7% |
| Spanish Americans | 0.8 /100 | #251 | Tragic 83.6% |
| Bahamians | 0.8 /100 | #252 | Tragic 83.6% |
| Comanche | 0.7 /100 | #253 | Tragic 83.6% |
| Creek | 0.7 /100 | #254 | Tragic 83.6% |
| Colville | 0.5 /100 | #255 | Tragic 83.4% |
| Africans | 0.5 /100 | #256 | Tragic 83.4% |