Cherokee vs Immigrants from Czechoslovakia Single Father Households
COMPARE
Cherokee
Immigrants from Czechoslovakia
Single Father Households
Single Father Households Comparison
Cherokee
Immigrants from Czechoslovakia
2.6%
SINGLE FATHER HOUSEHOLDS
0.1/ 100
METRIC RATING
278th/ 347
METRIC RANK
2.0%
SINGLE FATHER HOUSEHOLDS
99.9/ 100
METRIC RATING
58th/ 347
METRIC RANK
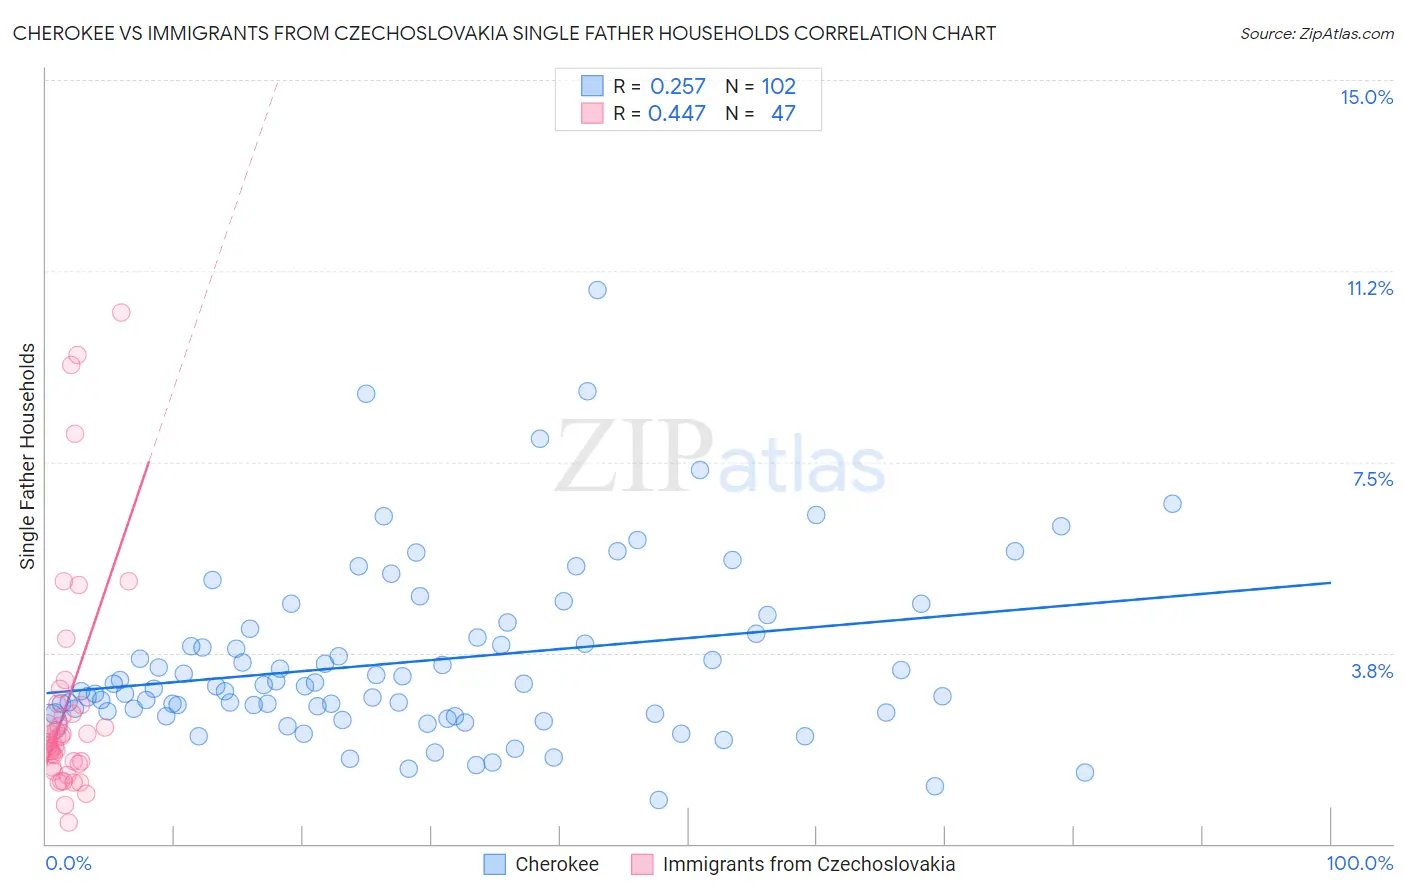
Cherokee vs Immigrants from Czechoslovakia Single Father Households Correlation Chart
The statistical analysis conducted on geographies consisting of 486,508,076 people shows a weak positive correlation between the proportion of Cherokee and percentage of single father households in the United States with a correlation coefficient (R) of 0.257 and weighted average of 2.6%. Similarly, the statistical analysis conducted on geographies consisting of 194,565,080 people shows a moderate positive correlation between the proportion of Immigrants from Czechoslovakia and percentage of single father households in the United States with a correlation coefficient (R) of 0.447 and weighted average of 2.0%, a difference of 29.0%.
Single Father Households Correlation Summary
| Measurement | Cherokee | Immigrants from Czechoslovakia |
| Minimum | 0.86% | 0.41% |
| Maximum | 10.9% | 10.4% |
| Range | 10.0% | 10.0% |
| Mean | 3.6% | 2.8% |
| Median | 3.1% | 2.0% |
| Interquartile 25% (IQ1) | 2.6% | 1.6% |
| Interquartile 75% (IQ3) | 4.1% | 2.7% |
| Interquartile Range (IQR) | 1.6% | 1.2% |
| Standard Deviation (Sample) | 1.7% | 2.3% |
| Standard Deviation (Population) | 1.7% | 2.3% |
Similar Demographics by Single Father Households
Demographics Similar to Cherokee by Single Father Households
In terms of single father households, the demographic groups most similar to Cherokee are Samoan (2.6%, a difference of 0.040%), Shoshone (2.6%, a difference of 0.050%), Immigrants from Haiti (2.6%, a difference of 0.080%), Immigrants from Dominican Republic (2.6%, a difference of 0.29%), and Immigrants from Portugal (2.6%, a difference of 0.59%).
| Demographics | Rating | Rank | Single Father Households |
| Creek | 0.2 /100 | #271 | Tragic 2.6% |
| Belizeans | 0.2 /100 | #272 | Tragic 2.6% |
| Iroquois | 0.2 /100 | #273 | Tragic 2.6% |
| Puerto Ricans | 0.2 /100 | #274 | Tragic 2.6% |
| Immigrants | Dominican Republic | 0.2 /100 | #275 | Tragic 2.6% |
| Immigrants | Haiti | 0.1 /100 | #276 | Tragic 2.6% |
| Shoshone | 0.1 /100 | #277 | Tragic 2.6% |
| Cherokee | 0.1 /100 | #278 | Tragic 2.6% |
| Samoans | 0.1 /100 | #279 | Tragic 2.6% |
| Immigrants | Portugal | 0.1 /100 | #280 | Tragic 2.6% |
| Nicaraguans | 0.1 /100 | #281 | Tragic 2.6% |
| Dutch West Indians | 0.1 /100 | #282 | Tragic 2.6% |
| Immigrants | Nicaragua | 0.1 /100 | #283 | Tragic 2.7% |
| Hawaiians | 0.1 /100 | #284 | Tragic 2.7% |
| Ottawa | 0.1 /100 | #285 | Tragic 2.7% |
Demographics Similar to Immigrants from Czechoslovakia by Single Father Households
In terms of single father households, the demographic groups most similar to Immigrants from Czechoslovakia are Burmese (2.0%, a difference of 0.020%), Immigrants from North Macedonia (2.0%, a difference of 0.11%), Immigrants from Austria (2.0%, a difference of 0.11%), Immigrants from Norway (2.0%, a difference of 0.29%), and Immigrants from France (2.0%, a difference of 0.31%).
| Demographics | Rating | Rank | Single Father Households |
| Immigrants | Poland | 99.9 /100 | #51 | Exceptional 2.0% |
| Immigrants | Europe | 99.9 /100 | #52 | Exceptional 2.0% |
| Immigrants | Northern Europe | 99.9 /100 | #53 | Exceptional 2.0% |
| Immigrants | Korea | 99.9 /100 | #54 | Exceptional 2.0% |
| Immigrants | France | 99.9 /100 | #55 | Exceptional 2.0% |
| Immigrants | Norway | 99.9 /100 | #56 | Exceptional 2.0% |
| Burmese | 99.9 /100 | #57 | Exceptional 2.0% |
| Immigrants | Czechoslovakia | 99.9 /100 | #58 | Exceptional 2.0% |
| Immigrants | North Macedonia | 99.9 /100 | #59 | Exceptional 2.0% |
| Immigrants | Austria | 99.9 /100 | #60 | Exceptional 2.0% |
| Vietnamese | 99.9 /100 | #61 | Exceptional 2.0% |
| Immigrants | Malaysia | 99.9 /100 | #62 | Exceptional 2.0% |
| Maltese | 99.9 /100 | #63 | Exceptional 2.0% |
| Mongolians | 99.9 /100 | #64 | Exceptional 2.1% |
| Paraguayans | 99.9 /100 | #65 | Exceptional 2.1% |