Cherokee vs Native Hawaiian Median Family Income
COMPARE
Cherokee
Native Hawaiian
Median Family Income
Median Family Income Comparison
Cherokee
Native Hawaiians
$88,209
MEDIAN FAMILY INCOME
0.1/ 100
METRIC RATING
288th/ 347
METRIC RANK
$104,910
MEDIAN FAMILY INCOME
75.8/ 100
METRIC RATING
155th/ 347
METRIC RANK
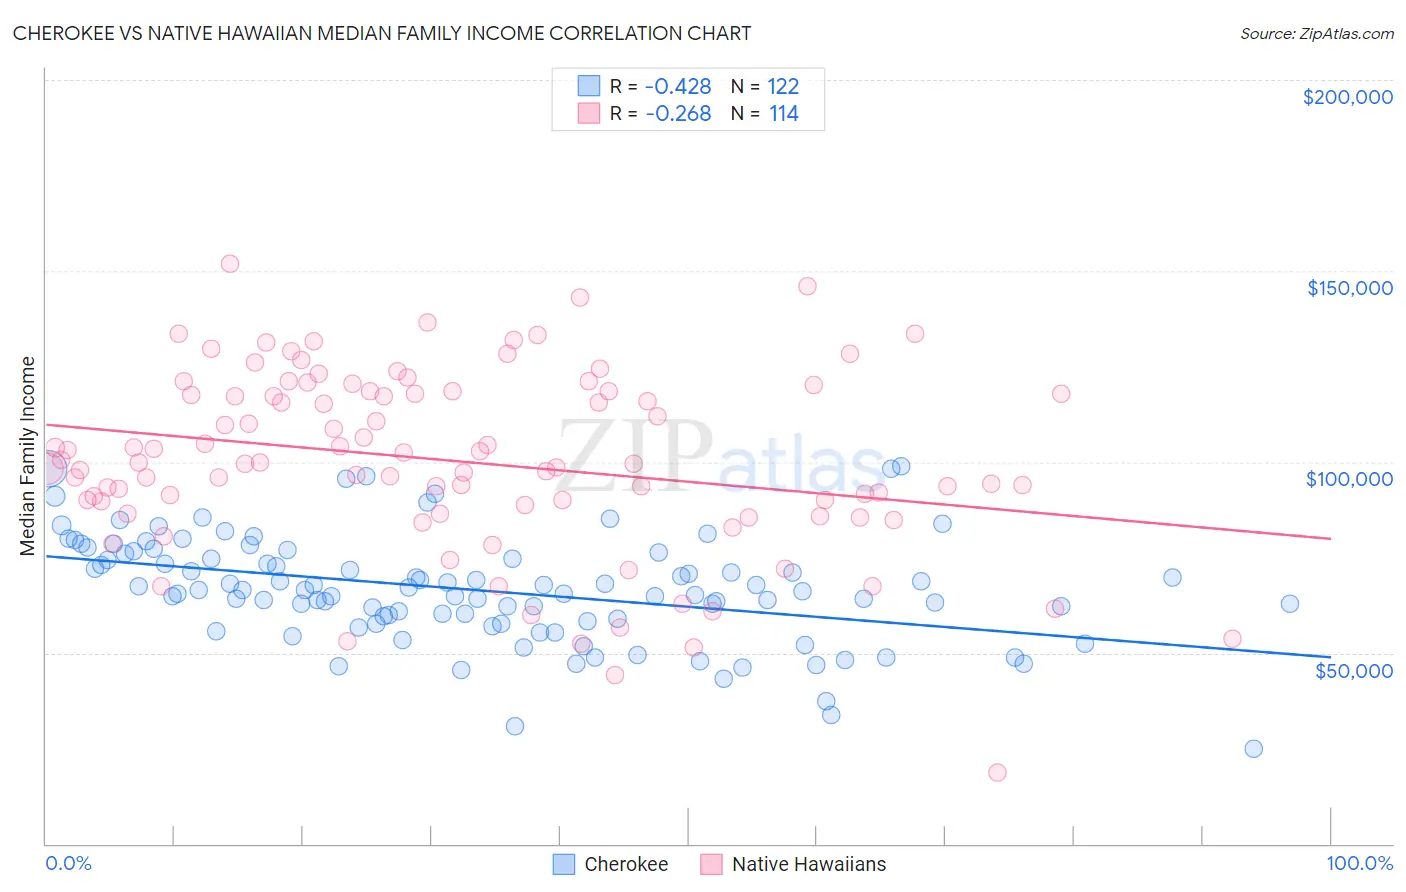
Cherokee vs Native Hawaiian Median Family Income Correlation Chart
The statistical analysis conducted on geographies consisting of 493,078,219 people shows a moderate negative correlation between the proportion of Cherokee and median family income in the United States with a correlation coefficient (R) of -0.428 and weighted average of $88,209. Similarly, the statistical analysis conducted on geographies consisting of 331,783,011 people shows a weak negative correlation between the proportion of Native Hawaiians and median family income in the United States with a correlation coefficient (R) of -0.268 and weighted average of $104,910, a difference of 18.9%.
Median Family Income Correlation Summary
| Measurement | Cherokee | Native Hawaiian |
| Minimum | $25,000 | $18,796 |
| Maximum | $98,929 | $151,740 |
| Range | $73,929 | $132,944 |
| Mean | $66,366 | $100,179 |
| Median | $66,333 | $99,798 |
| Interquartile 25% (IQ1) | $58,393 | $88,761 |
| Interquartile 75% (IQ3) | $74,712 | $118,333 |
| Interquartile Range (IQR) | $16,319 | $29,572 |
| Standard Deviation (Sample) | $13,972 | $23,926 |
| Standard Deviation (Population) | $13,915 | $23,821 |
Similar Demographics by Median Family Income
Demographics Similar to Cherokee by Median Family Income
In terms of median family income, the demographic groups most similar to Cherokee are Potawatomi ($88,265, a difference of 0.060%), Immigrants from Nicaragua ($88,267, a difference of 0.070%), Indonesian ($88,301, a difference of 0.10%), Guatemalan ($88,295, a difference of 0.10%), and Bangladeshi ($88,358, a difference of 0.17%).
| Demographics | Rating | Rank | Median Family Income |
| Blackfeet | 0.1 /100 | #281 | Tragic $88,717 |
| Comanche | 0.1 /100 | #282 | Tragic $88,556 |
| Bangladeshis | 0.1 /100 | #283 | Tragic $88,358 |
| Indonesians | 0.1 /100 | #284 | Tragic $88,301 |
| Guatemalans | 0.1 /100 | #285 | Tragic $88,295 |
| Immigrants | Nicaragua | 0.1 /100 | #286 | Tragic $88,267 |
| Potawatomi | 0.1 /100 | #287 | Tragic $88,265 |
| Cherokee | 0.1 /100 | #288 | Tragic $88,209 |
| Central American Indians | 0.1 /100 | #289 | Tragic $88,034 |
| Shoshone | 0.1 /100 | #290 | Tragic $87,872 |
| Immigrants | Cabo Verde | 0.1 /100 | #291 | Tragic $87,830 |
| Africans | 0.1 /100 | #292 | Tragic $87,820 |
| Ute | 0.0 /100 | #293 | Tragic $87,596 |
| Fijians | 0.0 /100 | #294 | Tragic $87,387 |
| Yaqui | 0.0 /100 | #295 | Tragic $87,289 |
Demographics Similar to Native Hawaiians by Median Family Income
In terms of median family income, the demographic groups most similar to Native Hawaiians are Immigrants from Nepal ($104,966, a difference of 0.050%), Basque ($104,760, a difference of 0.14%), Slavic ($105,144, a difference of 0.22%), Immigrants from Albania ($105,285, a difference of 0.36%), and Moroccan ($104,488, a difference of 0.40%).
| Demographics | Rating | Rank | Median Family Income |
| Hungarians | 81.7 /100 | #148 | Excellent $105,609 |
| Immigrants | Germany | 80.9 /100 | #149 | Excellent $105,507 |
| Irish | 80.5 /100 | #150 | Excellent $105,453 |
| Peruvians | 80.4 /100 | #151 | Excellent $105,444 |
| Immigrants | Albania | 79.1 /100 | #152 | Good $105,285 |
| Slavs | 77.9 /100 | #153 | Good $105,144 |
| Immigrants | Nepal | 76.3 /100 | #154 | Good $104,966 |
| Native Hawaiians | 75.8 /100 | #155 | Good $104,910 |
| Basques | 74.4 /100 | #156 | Good $104,760 |
| Moroccans | 71.6 /100 | #157 | Good $104,488 |
| Scandinavians | 70.8 /100 | #158 | Good $104,410 |
| Swiss | 70.7 /100 | #159 | Good $104,396 |
| Scottish | 69.5 /100 | #160 | Good $104,288 |
| Icelanders | 69.4 /100 | #161 | Good $104,282 |
| Immigrants | Sierra Leone | 66.2 /100 | #162 | Good $103,990 |