Central American Indian vs Pennsylvania German Householder Income Ages 45 - 64 years
COMPARE
Central American Indian
Pennsylvania German
Householder Income Ages 45 - 64 years
Householder Income Ages 45 - 64 years Comparison
Central American Indians
Pennsylvania Germans
$86,764
HOUSEHOLDER INCOME AGES 45 - 64 YEARS
0.1/ 100
METRIC RATING
284th/ 347
METRIC RANK
$91,956
HOUSEHOLDER INCOME AGES 45 - 64 YEARS
1.5/ 100
METRIC RATING
238th/ 347
METRIC RANK
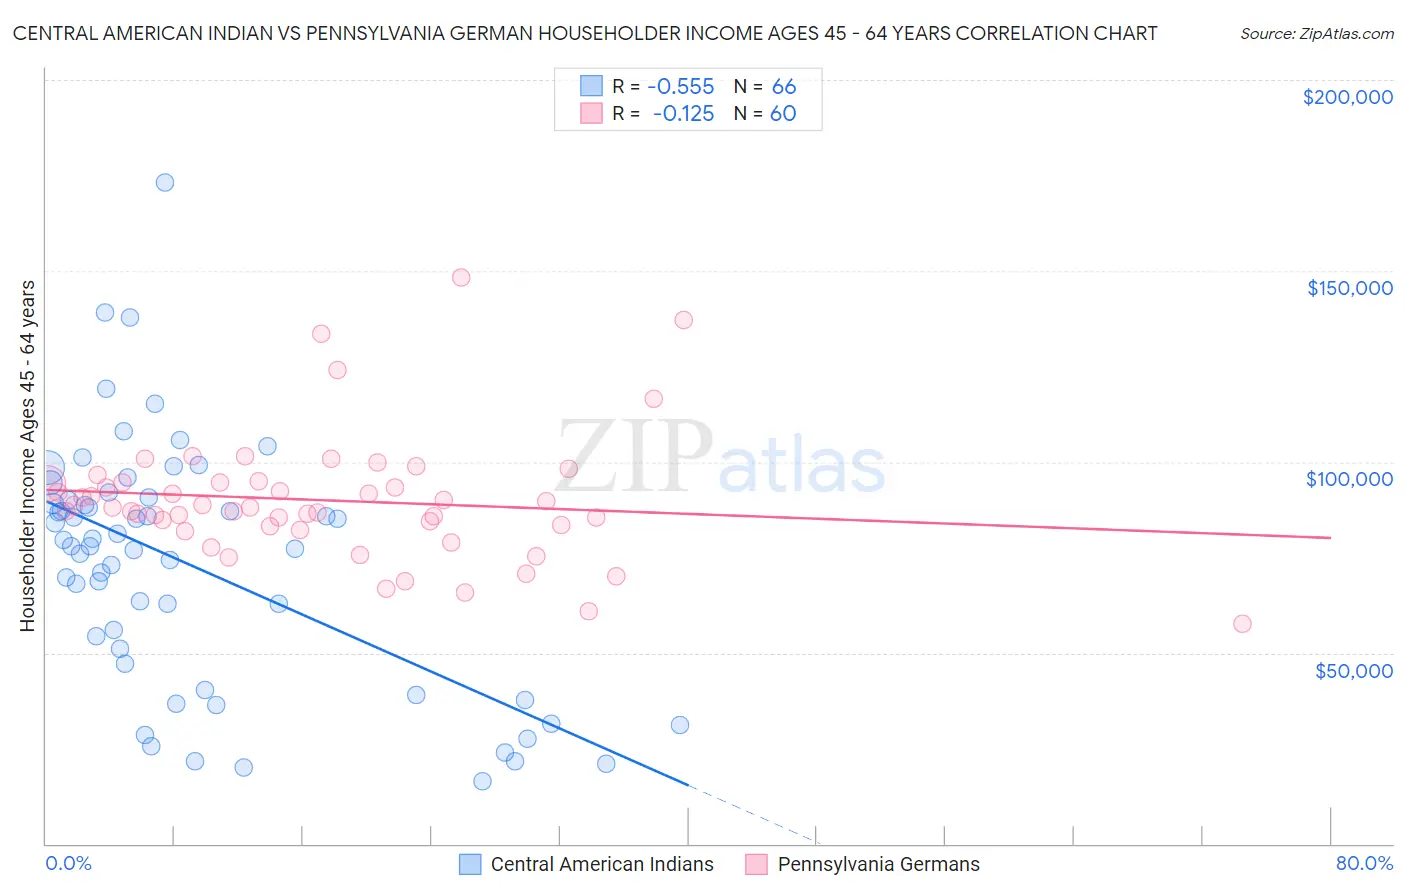
Central American Indian vs Pennsylvania German Householder Income Ages 45 - 64 years Correlation Chart
The statistical analysis conducted on geographies consisting of 325,794,243 people shows a substantial negative correlation between the proportion of Central American Indians and household income with householder between the ages 45 and 64 in the United States with a correlation coefficient (R) of -0.555 and weighted average of $86,764. Similarly, the statistical analysis conducted on geographies consisting of 233,806,042 people shows a poor negative correlation between the proportion of Pennsylvania Germans and household income with householder between the ages 45 and 64 in the United States with a correlation coefficient (R) of -0.125 and weighted average of $91,956, a difference of 6.0%.
Householder Income Ages 45 - 64 years Correlation Summary
| Measurement | Central American Indian | Pennsylvania German |
| Minimum | $16,412 | $57,750 |
| Maximum | $173,000 | $148,333 |
| Range | $156,588 | $90,583 |
| Mean | $72,864 | $89,968 |
| Median | $78,027 | $88,175 |
| Interquartile 25% (IQ1) | $47,059 | $83,450 |
| Interquartile 75% (IQ3) | $90,095 | $94,494 |
| Interquartile Range (IQR) | $43,036 | $11,044 |
| Standard Deviation (Sample) | $32,226 | $16,415 |
| Standard Deviation (Population) | $31,981 | $16,277 |
Similar Demographics by Householder Income Ages 45 - 64 years
Demographics Similar to Central American Indians by Householder Income Ages 45 - 64 years
In terms of householder income ages 45 - 64 years, the demographic groups most similar to Central American Indians are Mexican ($86,816, a difference of 0.060%), Senegalese ($86,897, a difference of 0.15%), Yaqui ($86,914, a difference of 0.17%), Blackfeet ($86,595, a difference of 0.20%), and Immigrants from Guatemala ($86,573, a difference of 0.22%).
| Demographics | Rating | Rank | Householder Income Ages 45 - 64 years |
| Cree | 0.1 /100 | #277 | Tragic $87,185 |
| Immigrants | Jamaica | 0.1 /100 | #278 | Tragic $87,035 |
| Yakama | 0.1 /100 | #279 | Tragic $86,992 |
| Immigrants | Somalia | 0.1 /100 | #280 | Tragic $86,987 |
| Yaqui | 0.1 /100 | #281 | Tragic $86,914 |
| Senegalese | 0.1 /100 | #282 | Tragic $86,897 |
| Mexicans | 0.1 /100 | #283 | Tragic $86,816 |
| Central American Indians | 0.1 /100 | #284 | Tragic $86,764 |
| Blackfeet | 0.1 /100 | #285 | Tragic $86,595 |
| Immigrants | Guatemala | 0.1 /100 | #286 | Tragic $86,573 |
| Bangladeshis | 0.1 /100 | #287 | Tragic $86,402 |
| Immigrants | St. Vincent and the Grenadines | 0.1 /100 | #288 | Tragic $86,394 |
| Cubans | 0.1 /100 | #289 | Tragic $86,301 |
| Cherokee | 0.1 /100 | #290 | Tragic $86,125 |
| Hispanics or Latinos | 0.1 /100 | #291 | Tragic $86,006 |
Demographics Similar to Pennsylvania Germans by Householder Income Ages 45 - 64 years
In terms of householder income ages 45 - 64 years, the demographic groups most similar to Pennsylvania Germans are Immigrants from Bangladesh ($92,208, a difference of 0.27%), Immigrants from Western Africa ($92,384, a difference of 0.46%), Immigrants from Ecuador ($91,462, a difference of 0.54%), Immigrants from Burma/Myanmar ($91,385, a difference of 0.63%), and Nicaraguan ($92,554, a difference of 0.65%).
| Demographics | Rating | Rank | Householder Income Ages 45 - 64 years |
| Ecuadorians | 3.6 /100 | #231 | Tragic $93,739 |
| Sudanese | 3.5 /100 | #232 | Tragic $93,718 |
| Nepalese | 3.0 /100 | #233 | Tragic $93,355 |
| Immigrants | El Salvador | 2.7 /100 | #234 | Tragic $93,176 |
| Nicaraguans | 2.0 /100 | #235 | Tragic $92,554 |
| Immigrants | Western Africa | 1.8 /100 | #236 | Tragic $92,384 |
| Immigrants | Bangladesh | 1.7 /100 | #237 | Tragic $92,208 |
| Pennsylvania Germans | 1.5 /100 | #238 | Tragic $91,956 |
| Immigrants | Ecuador | 1.2 /100 | #239 | Tragic $91,462 |
| Immigrants | Burma/Myanmar | 1.1 /100 | #240 | Tragic $91,385 |
| Trinidadians and Tobagonians | 1.1 /100 | #241 | Tragic $91,357 |
| Inupiat | 1.1 /100 | #242 | Tragic $91,355 |
| Immigrants | Trinidad and Tobago | 1.1 /100 | #243 | Tragic $91,347 |
| Immigrants | Middle Africa | 1.1 /100 | #244 | Tragic $91,293 |
| Guyanese | 0.9 /100 | #245 | Tragic $90,966 |