Central American Indian vs Pennsylvania German 2nd Grade
COMPARE
Central American Indian
Pennsylvania German
2nd Grade
2nd Grade Comparison
Central American Indians
Pennsylvania Germans
97.0%
2ND GRADE
0.0/ 100
METRIC RATING
301st/ 347
METRIC RANK
98.5%
2ND GRADE
100.0/ 100
METRIC RATING
24th/ 347
METRIC RANK
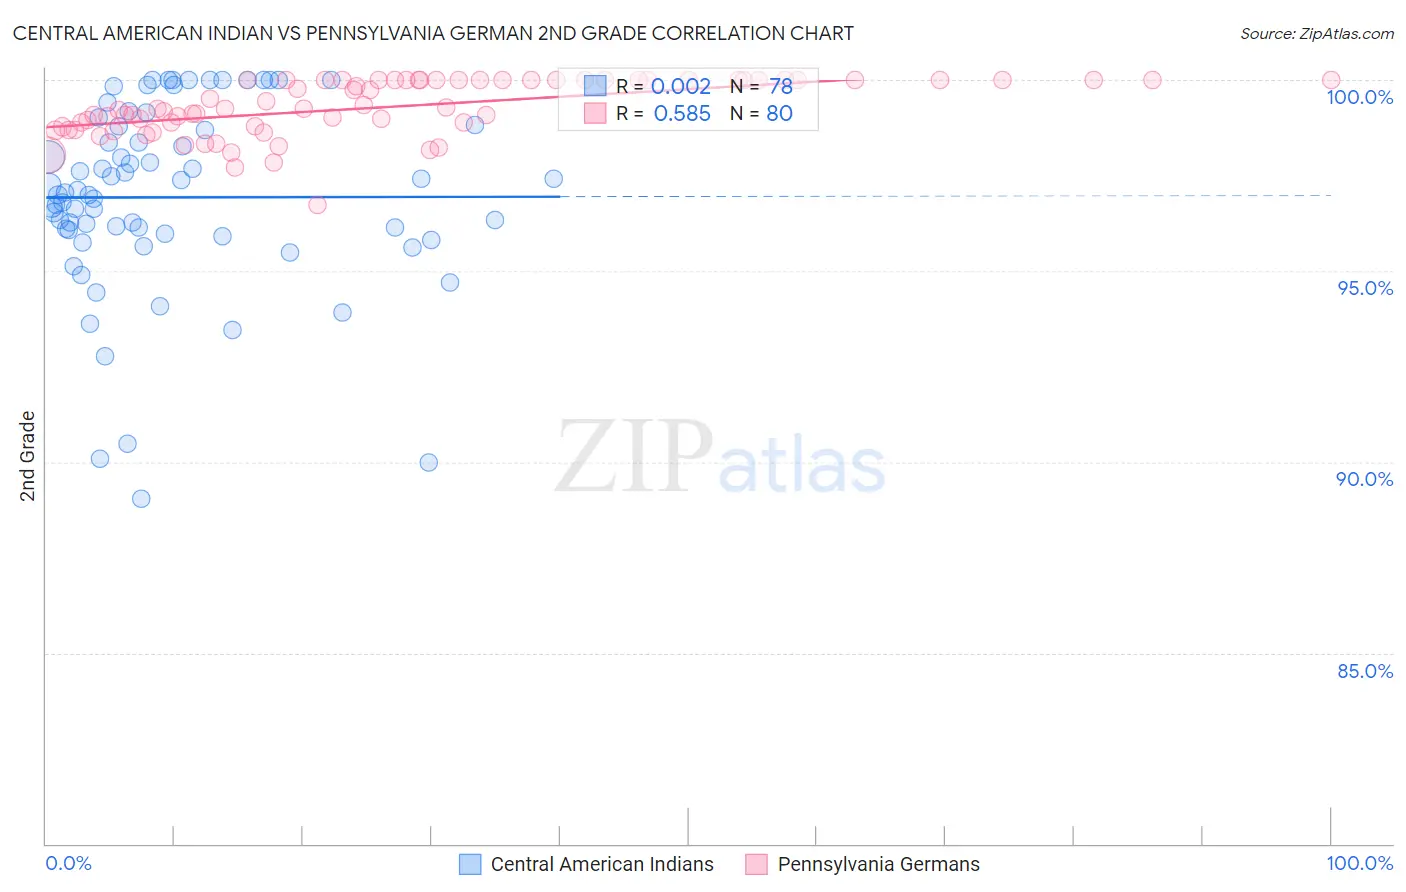
Central American Indian vs Pennsylvania German 2nd Grade Correlation Chart
The statistical analysis conducted on geographies consisting of 326,141,205 people shows no correlation between the proportion of Central American Indians and percentage of population with at least 2nd grade education in the United States with a correlation coefficient (R) of 0.002 and weighted average of 97.0%. Similarly, the statistical analysis conducted on geographies consisting of 234,102,531 people shows a substantial positive correlation between the proportion of Pennsylvania Germans and percentage of population with at least 2nd grade education in the United States with a correlation coefficient (R) of 0.585 and weighted average of 98.5%, a difference of 1.6%.
2nd Grade Correlation Summary
| Measurement | Central American Indian | Pennsylvania German |
| Minimum | 89.0% | 96.7% |
| Maximum | 100.0% | 100.0% |
| Range | 11.0% | 3.3% |
| Mean | 96.9% | 99.3% |
| Median | 97.0% | 99.2% |
| Interquartile 25% (IQ1) | 96.0% | 98.8% |
| Interquartile 75% (IQ3) | 98.8% | 100.0% |
| Interquartile Range (IQR) | 2.8% | 1.2% |
| Standard Deviation (Sample) | 2.5% | 0.73% |
| Standard Deviation (Population) | 2.4% | 0.73% |
Similar Demographics by 2nd Grade
Demographics Similar to Central American Indians by 2nd Grade
In terms of 2nd grade, the demographic groups most similar to Central American Indians are Immigrants from South Eastern Asia (97.0%, a difference of 0.020%), Somali (97.0%, a difference of 0.020%), Immigrants from Cuba (97.0%, a difference of 0.040%), Immigrants from Dominica (97.0%, a difference of 0.040%), and Haitian (97.0%, a difference of 0.040%).
| Demographics | Rating | Rank | 2nd Grade |
| Malaysians | 0.0 /100 | #294 | Tragic 97.1% |
| Immigrants | Grenada | 0.0 /100 | #295 | Tragic 97.1% |
| Immigrants | Immigrants | 0.0 /100 | #296 | Tragic 97.1% |
| Immigrants | Cuba | 0.0 /100 | #297 | Tragic 97.0% |
| Immigrants | Dominica | 0.0 /100 | #298 | Tragic 97.0% |
| Haitians | 0.0 /100 | #299 | Tragic 97.0% |
| Immigrants | South Eastern Asia | 0.0 /100 | #300 | Tragic 97.0% |
| Central American Indians | 0.0 /100 | #301 | Tragic 97.0% |
| Somalis | 0.0 /100 | #302 | Tragic 97.0% |
| Ecuadorians | 0.0 /100 | #303 | Tragic 96.9% |
| Immigrants | Caribbean | 0.0 /100 | #304 | Tragic 96.9% |
| Nicaraguans | 0.0 /100 | #305 | Tragic 96.9% |
| Immigrants | Somalia | 0.0 /100 | #306 | Tragic 96.9% |
| Immigrants | Azores | 0.0 /100 | #307 | Tragic 96.8% |
| Immigrants | Haiti | 0.0 /100 | #308 | Tragic 96.8% |
Demographics Similar to Pennsylvania Germans by 2nd Grade
In terms of 2nd grade, the demographic groups most similar to Pennsylvania Germans are Finnish (98.5%, a difference of 0.0%), Sioux (98.5%, a difference of 0.0%), Lithuanian (98.5%, a difference of 0.0%), Polish (98.5%, a difference of 0.0%), and Danish (98.5%, a difference of 0.0%).
| Demographics | Rating | Rank | 2nd Grade |
| Aleuts | 100.0 /100 | #17 | Exceptional 98.6% |
| Irish | 100.0 /100 | #18 | Exceptional 98.6% |
| Finns | 100.0 /100 | #19 | Exceptional 98.5% |
| Sioux | 100.0 /100 | #20 | Exceptional 98.5% |
| Lithuanians | 100.0 /100 | #21 | Exceptional 98.5% |
| Poles | 100.0 /100 | #22 | Exceptional 98.5% |
| Danes | 100.0 /100 | #23 | Exceptional 98.5% |
| Pennsylvania Germans | 100.0 /100 | #24 | Exceptional 98.5% |
| Scotch-Irish | 100.0 /100 | #25 | Exceptional 98.5% |
| Welsh | 100.0 /100 | #26 | Exceptional 98.5% |
| Croatians | 100.0 /100 | #27 | Exceptional 98.5% |
| Arapaho | 100.0 /100 | #28 | Exceptional 98.5% |
| French | 100.0 /100 | #29 | Exceptional 98.5% |
| Europeans | 100.0 /100 | #30 | Exceptional 98.5% |
| Czechs | 100.0 /100 | #31 | Exceptional 98.5% |