European vs Pennsylvania German Householder Income Ages 45 - 64 years
COMPARE
European
Pennsylvania German
Householder Income Ages 45 - 64 years
Householder Income Ages 45 - 64 years Comparison
Europeans
Pennsylvania Germans
$106,367
HOUSEHOLDER INCOME AGES 45 - 64 YEARS
95.4/ 100
METRIC RATING
113th/ 347
METRIC RANK
$91,956
HOUSEHOLDER INCOME AGES 45 - 64 YEARS
1.5/ 100
METRIC RATING
238th/ 347
METRIC RANK
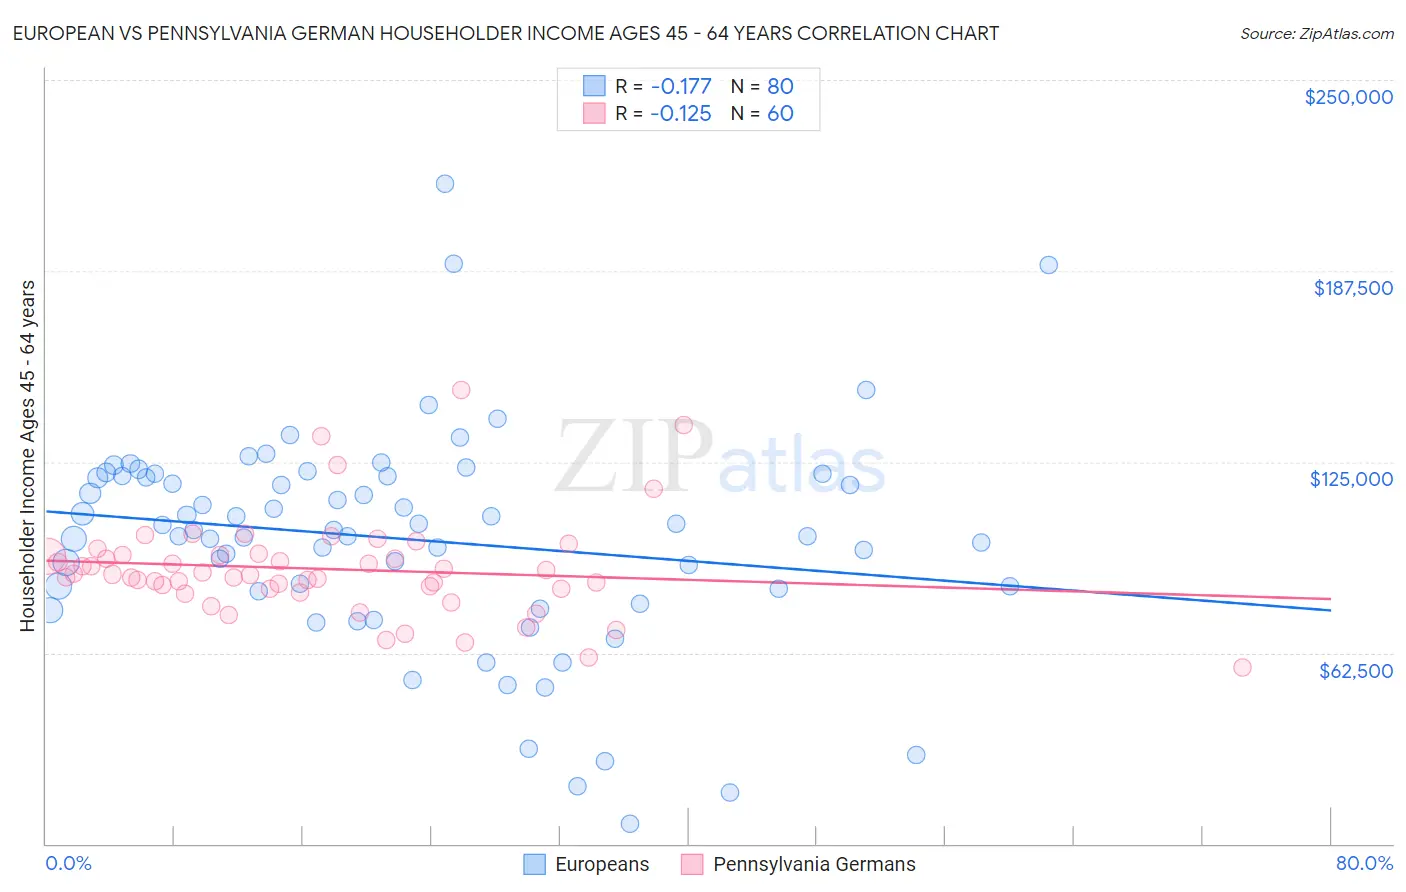
European vs Pennsylvania German Householder Income Ages 45 - 64 years Correlation Chart
The statistical analysis conducted on geographies consisting of 558,626,561 people shows a poor negative correlation between the proportion of Europeans and household income with householder between the ages 45 and 64 in the United States with a correlation coefficient (R) of -0.177 and weighted average of $106,367. Similarly, the statistical analysis conducted on geographies consisting of 233,806,042 people shows a poor negative correlation between the proportion of Pennsylvania Germans and household income with householder between the ages 45 and 64 in the United States with a correlation coefficient (R) of -0.125 and weighted average of $91,956, a difference of 15.7%.
Householder Income Ages 45 - 64 years Correlation Summary
| Measurement | European | Pennsylvania German |
| Minimum | $6,604 | $57,750 |
| Maximum | $216,139 | $148,333 |
| Range | $209,535 | $90,583 |
| Mean | $99,691 | $89,968 |
| Median | $102,766 | $88,175 |
| Interquartile 25% (IQ1) | $82,969 | $83,450 |
| Interquartile 75% (IQ3) | $120,255 | $94,494 |
| Interquartile Range (IQR) | $37,286 | $11,044 |
| Standard Deviation (Sample) | $35,975 | $16,415 |
| Standard Deviation (Population) | $35,750 | $16,277 |
Similar Demographics by Householder Income Ages 45 - 64 years
Demographics Similar to Europeans by Householder Income Ages 45 - 64 years
In terms of householder income ages 45 - 64 years, the demographic groups most similar to Europeans are Swedish ($106,377, a difference of 0.010%), Immigrants from Vietnam ($106,417, a difference of 0.050%), Immigrants from Poland ($106,319, a difference of 0.050%), Immigrants from Kuwait ($106,285, a difference of 0.080%), and Immigrants from Brazil ($106,470, a difference of 0.10%).
| Demographics | Rating | Rank | Householder Income Ages 45 - 64 years |
| Armenians | 96.6 /100 | #106 | Exceptional $107,002 |
| Immigrants | Fiji | 96.5 /100 | #107 | Exceptional $106,952 |
| Zimbabweans | 96.3 /100 | #108 | Exceptional $106,849 |
| Chileans | 95.9 /100 | #109 | Exceptional $106,611 |
| Immigrants | Brazil | 95.6 /100 | #110 | Exceptional $106,470 |
| Immigrants | Vietnam | 95.5 /100 | #111 | Exceptional $106,417 |
| Swedes | 95.4 /100 | #112 | Exceptional $106,377 |
| Europeans | 95.4 /100 | #113 | Exceptional $106,367 |
| Immigrants | Poland | 95.3 /100 | #114 | Exceptional $106,319 |
| Immigrants | Kuwait | 95.2 /100 | #115 | Exceptional $106,285 |
| British | 95.2 /100 | #116 | Exceptional $106,264 |
| Albanians | 95.1 /100 | #117 | Exceptional $106,243 |
| Immigrants | Western Asia | 95.0 /100 | #118 | Exceptional $106,217 |
| Immigrants | Jordan | 94.9 /100 | #119 | Exceptional $106,164 |
| Immigrants | South Eastern Asia | 94.8 /100 | #120 | Exceptional $106,109 |
Demographics Similar to Pennsylvania Germans by Householder Income Ages 45 - 64 years
In terms of householder income ages 45 - 64 years, the demographic groups most similar to Pennsylvania Germans are Immigrants from Bangladesh ($92,208, a difference of 0.27%), Immigrants from Western Africa ($92,384, a difference of 0.46%), Immigrants from Ecuador ($91,462, a difference of 0.54%), Immigrants from Burma/Myanmar ($91,385, a difference of 0.63%), and Nicaraguan ($92,554, a difference of 0.65%).
| Demographics | Rating | Rank | Householder Income Ages 45 - 64 years |
| Ecuadorians | 3.6 /100 | #231 | Tragic $93,739 |
| Sudanese | 3.5 /100 | #232 | Tragic $93,718 |
| Nepalese | 3.0 /100 | #233 | Tragic $93,355 |
| Immigrants | El Salvador | 2.7 /100 | #234 | Tragic $93,176 |
| Nicaraguans | 2.0 /100 | #235 | Tragic $92,554 |
| Immigrants | Western Africa | 1.8 /100 | #236 | Tragic $92,384 |
| Immigrants | Bangladesh | 1.7 /100 | #237 | Tragic $92,208 |
| Pennsylvania Germans | 1.5 /100 | #238 | Tragic $91,956 |
| Immigrants | Ecuador | 1.2 /100 | #239 | Tragic $91,462 |
| Immigrants | Burma/Myanmar | 1.1 /100 | #240 | Tragic $91,385 |
| Trinidadians and Tobagonians | 1.1 /100 | #241 | Tragic $91,357 |
| Inupiat | 1.1 /100 | #242 | Tragic $91,355 |
| Immigrants | Trinidad and Tobago | 1.1 /100 | #243 | Tragic $91,347 |
| Immigrants | Middle Africa | 1.1 /100 | #244 | Tragic $91,293 |
| Guyanese | 0.9 /100 | #245 | Tragic $90,966 |