Central American Indian vs Pennsylvania German Male Unemployment
COMPARE
Central American Indian
Pennsylvania German
Male Unemployment
Male Unemployment Comparison
Central American Indians
Pennsylvania Germans
6.3%
MALE UNEMPLOYMENT
0.0/ 100
METRIC RATING
287th/ 347
METRIC RANK
4.8%
MALE UNEMPLOYMENT
99.9/ 100
METRIC RATING
20th/ 347
METRIC RANK
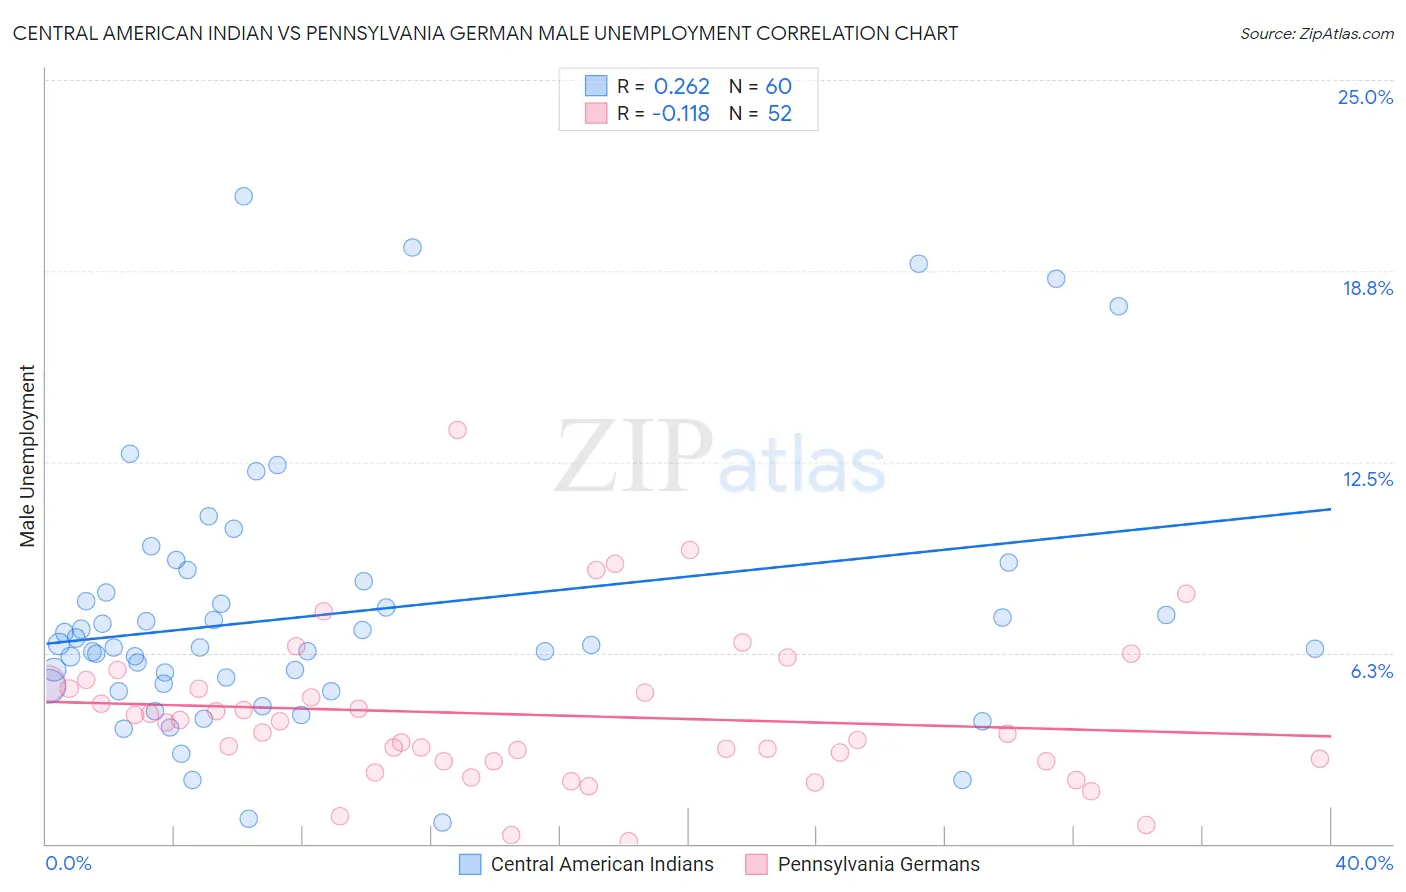
Central American Indian vs Pennsylvania German Male Unemployment Correlation Chart
The statistical analysis conducted on geographies consisting of 325,394,182 people shows a weak positive correlation between the proportion of Central American Indians and unemployment rate among males in the United States with a correlation coefficient (R) of 0.262 and weighted average of 6.3%. Similarly, the statistical analysis conducted on geographies consisting of 232,803,431 people shows a poor negative correlation between the proportion of Pennsylvania Germans and unemployment rate among males in the United States with a correlation coefficient (R) of -0.118 and weighted average of 4.8%, a difference of 31.8%.
Male Unemployment Correlation Summary
| Measurement | Central American Indian | Pennsylvania German |
| Minimum | 0.70% | 0.10% |
| Maximum | 21.2% | 13.5% |
| Range | 20.5% | 13.4% |
| Mean | 7.5% | 4.2% |
| Median | 6.5% | 3.8% |
| Interquartile 25% (IQ1) | 5.2% | 2.7% |
| Interquartile 75% (IQ3) | 8.4% | 5.2% |
| Interquartile Range (IQR) | 3.2% | 2.5% |
| Standard Deviation (Sample) | 4.3% | 2.5% |
| Standard Deviation (Population) | 4.3% | 2.5% |
Similar Demographics by Male Unemployment
Demographics Similar to Central American Indians by Male Unemployment
In terms of male unemployment, the demographic groups most similar to Central American Indians are Immigrants from Senegal (6.3%, a difference of 0.040%), Immigrants from Caribbean (6.3%, a difference of 0.16%), African (6.3%, a difference of 0.29%), Immigrants from Ecuador (6.2%, a difference of 0.72%), and Spanish American Indian (6.2%, a difference of 0.74%).
| Demographics | Rating | Rank | Male Unemployment |
| Immigrants | Ghana | 0.0 /100 | #280 | Tragic 6.2% |
| Sierra Leoneans | 0.0 /100 | #281 | Tragic 6.2% |
| Ecuadorians | 0.0 /100 | #282 | Tragic 6.2% |
| Immigrants | Western Africa | 0.0 /100 | #283 | Tragic 6.2% |
| Spanish American Indians | 0.0 /100 | #284 | Tragic 6.2% |
| Immigrants | Ecuador | 0.0 /100 | #285 | Tragic 6.2% |
| Africans | 0.0 /100 | #286 | Tragic 6.3% |
| Central American Indians | 0.0 /100 | #287 | Tragic 6.3% |
| Immigrants | Senegal | 0.0 /100 | #288 | Tragic 6.3% |
| Immigrants | Caribbean | 0.0 /100 | #289 | Tragic 6.3% |
| U.S. Virgin Islanders | 0.0 /100 | #290 | Tragic 6.4% |
| Immigrants | Azores | 0.0 /100 | #291 | Tragic 6.4% |
| Nepalese | 0.0 /100 | #292 | Tragic 6.4% |
| Haitians | 0.0 /100 | #293 | Tragic 6.4% |
| Senegalese | 0.0 /100 | #294 | Tragic 6.4% |
Demographics Similar to Pennsylvania Germans by Male Unemployment
In terms of male unemployment, the demographic groups most similar to Pennsylvania Germans are European (4.8%, a difference of 0.050%), English (4.8%, a difference of 0.080%), Immigrants from Taiwan (4.8%, a difference of 0.16%), Carpatho Rusyn (4.8%, a difference of 0.18%), and Tongan (4.8%, a difference of 0.22%).
| Demographics | Rating | Rank | Male Unemployment |
| Bolivians | 100.0 /100 | #13 | Exceptional 4.7% |
| Germans | 100.0 /100 | #14 | Exceptional 4.7% |
| Scandinavians | 100.0 /100 | #15 | Exceptional 4.7% |
| Swiss | 99.9 /100 | #16 | Exceptional 4.7% |
| Filipinos | 99.9 /100 | #17 | Exceptional 4.7% |
| English | 99.9 /100 | #18 | Exceptional 4.8% |
| Europeans | 99.9 /100 | #19 | Exceptional 4.8% |
| Pennsylvania Germans | 99.9 /100 | #20 | Exceptional 4.8% |
| Immigrants | Taiwan | 99.9 /100 | #21 | Exceptional 4.8% |
| Carpatho Rusyns | 99.9 /100 | #22 | Exceptional 4.8% |
| Tongans | 99.9 /100 | #23 | Exceptional 4.8% |
| Immigrants | South Central Asia | 99.9 /100 | #24 | Exceptional 4.8% |
| Zimbabweans | 99.9 /100 | #25 | Exceptional 4.8% |
| Dutch | 99.9 /100 | #26 | Exceptional 4.8% |
| Belgians | 99.9 /100 | #27 | Exceptional 4.8% |