Central American Indian vs Native/Alaskan Householder Income Over 65 years
COMPARE
Central American Indian
Native/Alaskan
Householder Income Over 65 years
Householder Income Over 65 years Comparison
Central American Indians
Natives/Alaskans
$53,232
HOUSEHOLDER INCOME OVER 65 YEARS
0.0/ 100
METRIC RATING
298th/ 347
METRIC RANK
$52,081
HOUSEHOLDER INCOME OVER 65 YEARS
0.0/ 100
METRIC RATING
314th/ 347
METRIC RANK
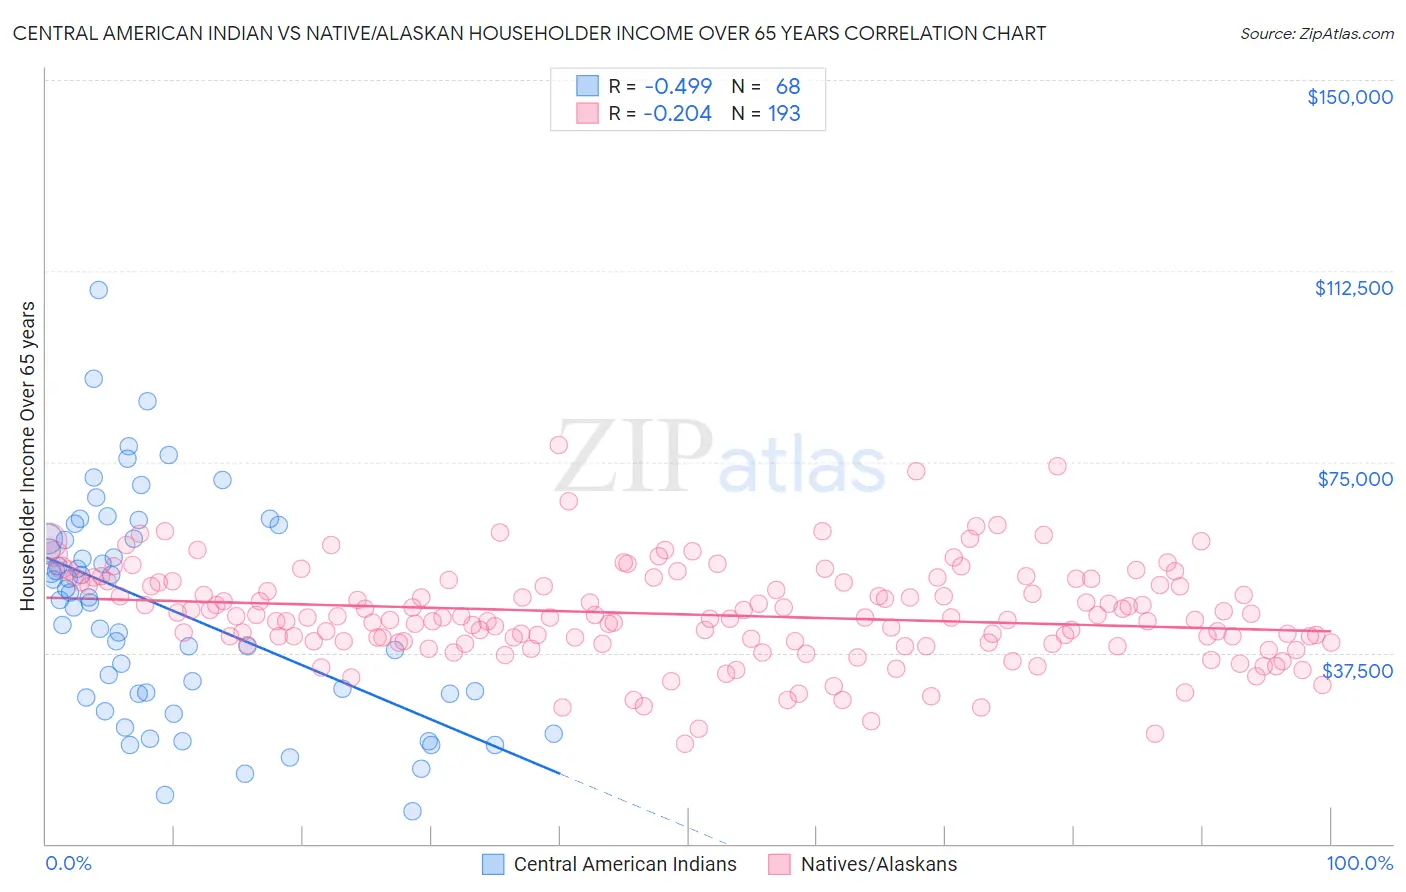
Central American Indian vs Native/Alaskan Householder Income Over 65 years Correlation Chart
The statistical analysis conducted on geographies consisting of 325,252,535 people shows a moderate negative correlation between the proportion of Central American Indians and household income with householder over the age of 65 in the United States with a correlation coefficient (R) of -0.499 and weighted average of $53,232. Similarly, the statistical analysis conducted on geographies consisting of 509,572,105 people shows a weak negative correlation between the proportion of Natives/Alaskans and household income with householder over the age of 65 in the United States with a correlation coefficient (R) of -0.204 and weighted average of $52,081, a difference of 2.2%.
Householder Income Over 65 years Correlation Summary
| Measurement | Central American Indian | Native/Alaskan |
| Minimum | $6,451 | $19,554 |
| Maximum | $108,875 | $78,193 |
| Range | $102,424 | $58,639 |
| Mean | $46,111 | $45,041 |
| Median | $48,148 | $44,466 |
| Interquartile 25% (IQ1) | $29,434 | $39,545 |
| Interquartile 75% (IQ3) | $59,835 | $51,398 |
| Interquartile Range (IQR) | $30,401 | $11,852 |
| Standard Deviation (Sample) | $21,274 | $9,551 |
| Standard Deviation (Population) | $21,117 | $9,526 |
Demographics Similar to Central American Indians and Natives/Alaskans by Householder Income Over 65 years
In terms of householder income over 65 years, the demographic groups most similar to Central American Indians are Ottawa ($53,217, a difference of 0.030%), Immigrants from Latin America ($53,265, a difference of 0.060%), Immigrants from Bahamas ($53,174, a difference of 0.11%), Immigrants from Somalia ($53,333, a difference of 0.19%), and Yuman ($53,110, a difference of 0.23%). Similarly, the demographic groups most similar to Natives/Alaskans are Immigrants from Nicaragua ($52,085, a difference of 0.010%), U.S. Virgin Islander ($52,072, a difference of 0.020%), Immigrants from the Azores ($52,121, a difference of 0.080%), Creek ($51,949, a difference of 0.25%), and Seminole ($52,373, a difference of 0.56%).
| Demographics | Rating | Rank | Householder Income Over 65 years |
| Immigrants | Somalia | 0.0 /100 | #296 | Tragic $53,333 |
| Immigrants | Latin America | 0.0 /100 | #297 | Tragic $53,265 |
| Central American Indians | 0.0 /100 | #298 | Tragic $53,232 |
| Ottawa | 0.0 /100 | #299 | Tragic $53,217 |
| Immigrants | Bahamas | 0.0 /100 | #300 | Tragic $53,174 |
| Yuman | 0.0 /100 | #301 | Tragic $53,110 |
| Spanish American Indians | 0.0 /100 | #302 | Tragic $53,077 |
| Choctaw | 0.0 /100 | #303 | Tragic $53,060 |
| Ute | 0.0 /100 | #304 | Tragic $52,949 |
| Pueblo | 0.0 /100 | #305 | Tragic $52,930 |
| Pennsylvania Germans | 0.0 /100 | #306 | Tragic $52,888 |
| Hispanics or Latinos | 0.0 /100 | #307 | Tragic $52,832 |
| Immigrants | Mexico | 0.0 /100 | #308 | Tragic $52,801 |
| Hondurans | 0.0 /100 | #309 | Tragic $52,634 |
| Sioux | 0.0 /100 | #310 | Tragic $52,509 |
| Seminole | 0.0 /100 | #311 | Tragic $52,373 |
| Immigrants | Azores | 0.0 /100 | #312 | Tragic $52,121 |
| Immigrants | Nicaragua | 0.0 /100 | #313 | Tragic $52,085 |
| Natives/Alaskans | 0.0 /100 | #314 | Tragic $52,081 |
| U.S. Virgin Islanders | 0.0 /100 | #315 | Tragic $52,072 |
| Creek | 0.0 /100 | #316 | Tragic $51,949 |