Central American Indian vs Sudanese Householder Income Over 65 years
COMPARE
Central American Indian
Sudanese
Householder Income Over 65 years
Householder Income Over 65 years Comparison
Central American Indians
Sudanese
$53,232
HOUSEHOLDER INCOME OVER 65 YEARS
0.0/ 100
METRIC RATING
298th/ 347
METRIC RANK
$58,281
HOUSEHOLDER INCOME OVER 65 YEARS
5.7/ 100
METRIC RATING
217th/ 347
METRIC RANK
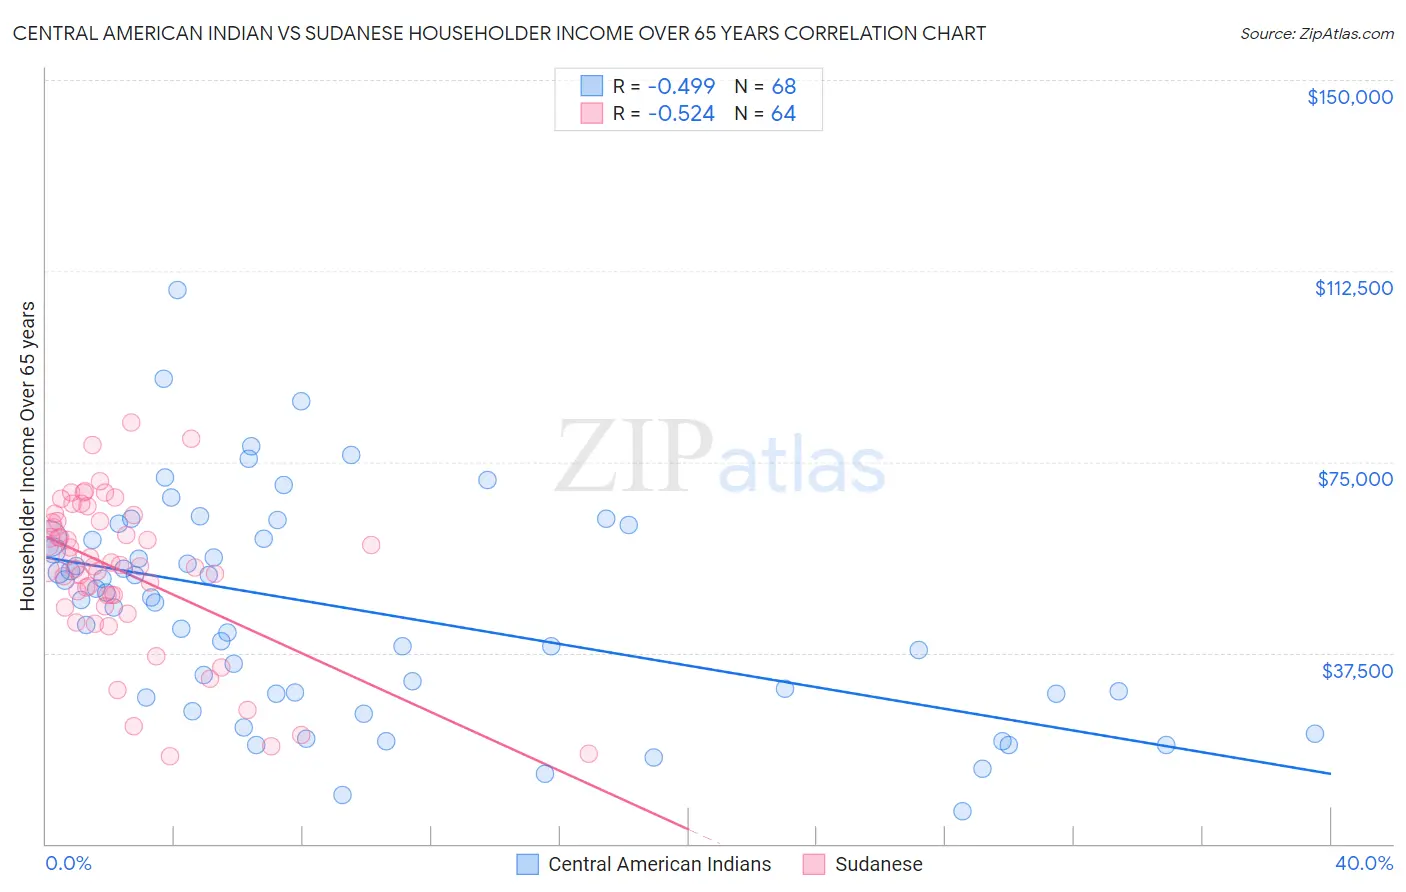
Central American Indian vs Sudanese Householder Income Over 65 years Correlation Chart
The statistical analysis conducted on geographies consisting of 325,252,535 people shows a moderate negative correlation between the proportion of Central American Indians and household income with householder over the age of 65 in the United States with a correlation coefficient (R) of -0.499 and weighted average of $53,232. Similarly, the statistical analysis conducted on geographies consisting of 109,968,006 people shows a substantial negative correlation between the proportion of Sudanese and household income with householder over the age of 65 in the United States with a correlation coefficient (R) of -0.524 and weighted average of $58,281, a difference of 9.5%.
Householder Income Over 65 years Correlation Summary
| Measurement | Central American Indian | Sudanese |
| Minimum | $6,451 | $17,083 |
| Maximum | $108,875 | $82,774 |
| Range | $102,424 | $65,691 |
| Mean | $46,111 | $53,447 |
| Median | $48,148 | $54,692 |
| Interquartile 25% (IQ1) | $29,434 | $47,752 |
| Interquartile 75% (IQ3) | $59,835 | $63,414 |
| Interquartile Range (IQR) | $30,401 | $15,662 |
| Standard Deviation (Sample) | $21,274 | $14,913 |
| Standard Deviation (Population) | $21,117 | $14,796 |
Similar Demographics by Householder Income Over 65 years
Demographics Similar to Central American Indians by Householder Income Over 65 years
In terms of householder income over 65 years, the demographic groups most similar to Central American Indians are Ottawa ($53,217, a difference of 0.030%), Immigrants from Latin America ($53,265, a difference of 0.060%), Immigrants from Bahamas ($53,174, a difference of 0.11%), Immigrants from Somalia ($53,333, a difference of 0.19%), and Yuman ($53,110, a difference of 0.23%).
| Demographics | Rating | Rank | Householder Income Over 65 years |
| Africans | 0.0 /100 | #291 | Tragic $53,711 |
| Shoshone | 0.0 /100 | #292 | Tragic $53,681 |
| Immigrants | Belize | 0.0 /100 | #293 | Tragic $53,665 |
| Senegalese | 0.0 /100 | #294 | Tragic $53,591 |
| Immigrants | Central America | 0.0 /100 | #295 | Tragic $53,420 |
| Immigrants | Somalia | 0.0 /100 | #296 | Tragic $53,333 |
| Immigrants | Latin America | 0.0 /100 | #297 | Tragic $53,265 |
| Central American Indians | 0.0 /100 | #298 | Tragic $53,232 |
| Ottawa | 0.0 /100 | #299 | Tragic $53,217 |
| Immigrants | Bahamas | 0.0 /100 | #300 | Tragic $53,174 |
| Yuman | 0.0 /100 | #301 | Tragic $53,110 |
| Spanish American Indians | 0.0 /100 | #302 | Tragic $53,077 |
| Choctaw | 0.0 /100 | #303 | Tragic $53,060 |
| Ute | 0.0 /100 | #304 | Tragic $52,949 |
| Pueblo | 0.0 /100 | #305 | Tragic $52,930 |
Demographics Similar to Sudanese by Householder Income Over 65 years
In terms of householder income over 65 years, the demographic groups most similar to Sudanese are Panamanian ($58,266, a difference of 0.030%), Malaysian ($58,244, a difference of 0.060%), Yugoslavian ($58,243, a difference of 0.070%), Immigrants from El Salvador ($58,226, a difference of 0.10%), and Delaware ($58,214, a difference of 0.11%).
| Demographics | Rating | Rank | Householder Income Over 65 years |
| Nigerians | 11.2 /100 | #210 | Poor $58,992 |
| Immigrants | Nigeria | 10.7 /100 | #211 | Poor $58,942 |
| Colombians | 9.8 /100 | #212 | Tragic $58,851 |
| Whites/Caucasians | 9.8 /100 | #213 | Tragic $58,847 |
| Nepalese | 9.0 /100 | #214 | Tragic $58,761 |
| Immigrants | Ghana | 7.9 /100 | #215 | Tragic $58,624 |
| Immigrants | Middle Africa | 6.2 /100 | #216 | Tragic $58,375 |
| Sudanese | 5.7 /100 | #217 | Tragic $58,281 |
| Panamanians | 5.6 /100 | #218 | Tragic $58,266 |
| Malaysians | 5.5 /100 | #219 | Tragic $58,244 |
| Yugoslavians | 5.5 /100 | #220 | Tragic $58,243 |
| Immigrants | El Salvador | 5.4 /100 | #221 | Tragic $58,226 |
| Delaware | 5.3 /100 | #222 | Tragic $58,214 |
| Tsimshian | 5.2 /100 | #223 | Tragic $58,202 |
| Bermudans | 5.1 /100 | #224 | Tragic $58,171 |