Immigrants from Honduras vs Native/Alaskan Householder Income Over 65 years
COMPARE
Immigrants from Honduras
Native/Alaskan
Householder Income Over 65 years
Householder Income Over 65 years Comparison
Immigrants from Honduras
Natives/Alaskans
$51,888
HOUSEHOLDER INCOME OVER 65 YEARS
0.0/ 100
METRIC RATING
319th/ 347
METRIC RANK
$52,081
HOUSEHOLDER INCOME OVER 65 YEARS
0.0/ 100
METRIC RATING
314th/ 347
METRIC RANK
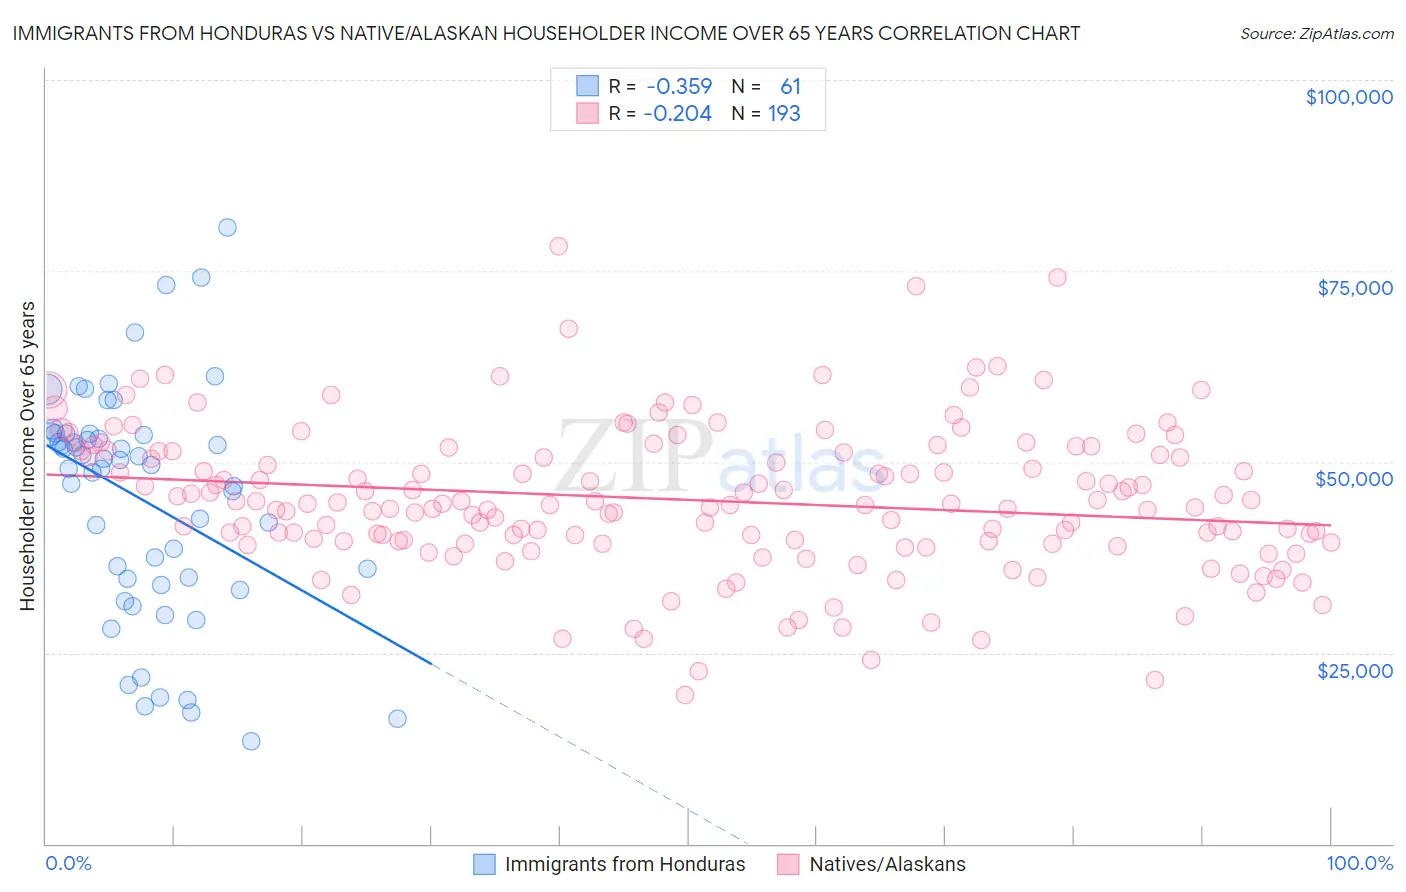
Immigrants from Honduras vs Native/Alaskan Householder Income Over 65 years Correlation Chart
The statistical analysis conducted on geographies consisting of 321,788,463 people shows a mild negative correlation between the proportion of Immigrants from Honduras and household income with householder over the age of 65 in the United States with a correlation coefficient (R) of -0.359 and weighted average of $51,888. Similarly, the statistical analysis conducted on geographies consisting of 509,572,105 people shows a weak negative correlation between the proportion of Natives/Alaskans and household income with householder over the age of 65 in the United States with a correlation coefficient (R) of -0.204 and weighted average of $52,081, a difference of 0.37%.
Householder Income Over 65 years Correlation Summary
| Measurement | Immigrants from Honduras | Native/Alaskan |
| Minimum | $13,371 | $19,554 |
| Maximum | $80,682 | $78,193 |
| Range | $67,311 | $58,639 |
| Mean | $45,102 | $45,041 |
| Median | $49,642 | $44,466 |
| Interquartile 25% (IQ1) | $34,344 | $39,545 |
| Interquartile 75% (IQ3) | $53,638 | $51,398 |
| Interquartile Range (IQR) | $19,294 | $11,852 |
| Standard Deviation (Sample) | $15,103 | $9,551 |
| Standard Deviation (Population) | $14,979 | $9,526 |
Demographics Similar to Immigrants from Honduras and Natives/Alaskans by Householder Income Over 65 years
In terms of householder income over 65 years, the demographic groups most similar to Immigrants from Honduras are Haitian ($51,912, a difference of 0.050%), Immigrants from St. Vincent and the Grenadines ($51,922, a difference of 0.070%), Creek ($51,949, a difference of 0.12%), Colville ($51,739, a difference of 0.29%), and Menominee ($51,719, a difference of 0.33%). Similarly, the demographic groups most similar to Natives/Alaskans are Immigrants from Nicaragua ($52,085, a difference of 0.010%), U.S. Virgin Islander ($52,072, a difference of 0.020%), Immigrants from the Azores ($52,121, a difference of 0.080%), Creek ($51,949, a difference of 0.25%), and Immigrants from St. Vincent and the Grenadines ($51,922, a difference of 0.30%).
| Demographics | Rating | Rank | Householder Income Over 65 years |
| Pennsylvania Germans | 0.0 /100 | #306 | Tragic $52,888 |
| Hispanics or Latinos | 0.0 /100 | #307 | Tragic $52,832 |
| Immigrants | Mexico | 0.0 /100 | #308 | Tragic $52,801 |
| Hondurans | 0.0 /100 | #309 | Tragic $52,634 |
| Sioux | 0.0 /100 | #310 | Tragic $52,509 |
| Seminole | 0.0 /100 | #311 | Tragic $52,373 |
| Immigrants | Azores | 0.0 /100 | #312 | Tragic $52,121 |
| Immigrants | Nicaragua | 0.0 /100 | #313 | Tragic $52,085 |
| Natives/Alaskans | 0.0 /100 | #314 | Tragic $52,081 |
| U.S. Virgin Islanders | 0.0 /100 | #315 | Tragic $52,072 |
| Creek | 0.0 /100 | #316 | Tragic $51,949 |
| Immigrants | St. Vincent and the Grenadines | 0.0 /100 | #317 | Tragic $51,922 |
| Haitians | 0.0 /100 | #318 | Tragic $51,912 |
| Immigrants | Honduras | 0.0 /100 | #319 | Tragic $51,888 |
| Colville | 0.0 /100 | #320 | Tragic $51,739 |
| Menominee | 0.0 /100 | #321 | Tragic $51,719 |
| British West Indians | 0.0 /100 | #322 | Tragic $51,463 |
| Cajuns | 0.0 /100 | #323 | Tragic $51,397 |
| Immigrants | Congo | 0.0 /100 | #324 | Tragic $51,393 |
| Immigrants | Haiti | 0.0 /100 | #325 | Tragic $51,219 |
| Kiowa | 0.0 /100 | #326 | Tragic $51,140 |