Central American Indian vs Immigrants from Kenya Householder Income Over 65 years
COMPARE
Central American Indian
Immigrants from Kenya
Householder Income Over 65 years
Householder Income Over 65 years Comparison
Central American Indians
Immigrants from Kenya
$53,232
HOUSEHOLDER INCOME OVER 65 YEARS
0.0/ 100
METRIC RATING
298th/ 347
METRIC RANK
$59,710
HOUSEHOLDER INCOME OVER 65 YEARS
21.1/ 100
METRIC RATING
197th/ 347
METRIC RANK
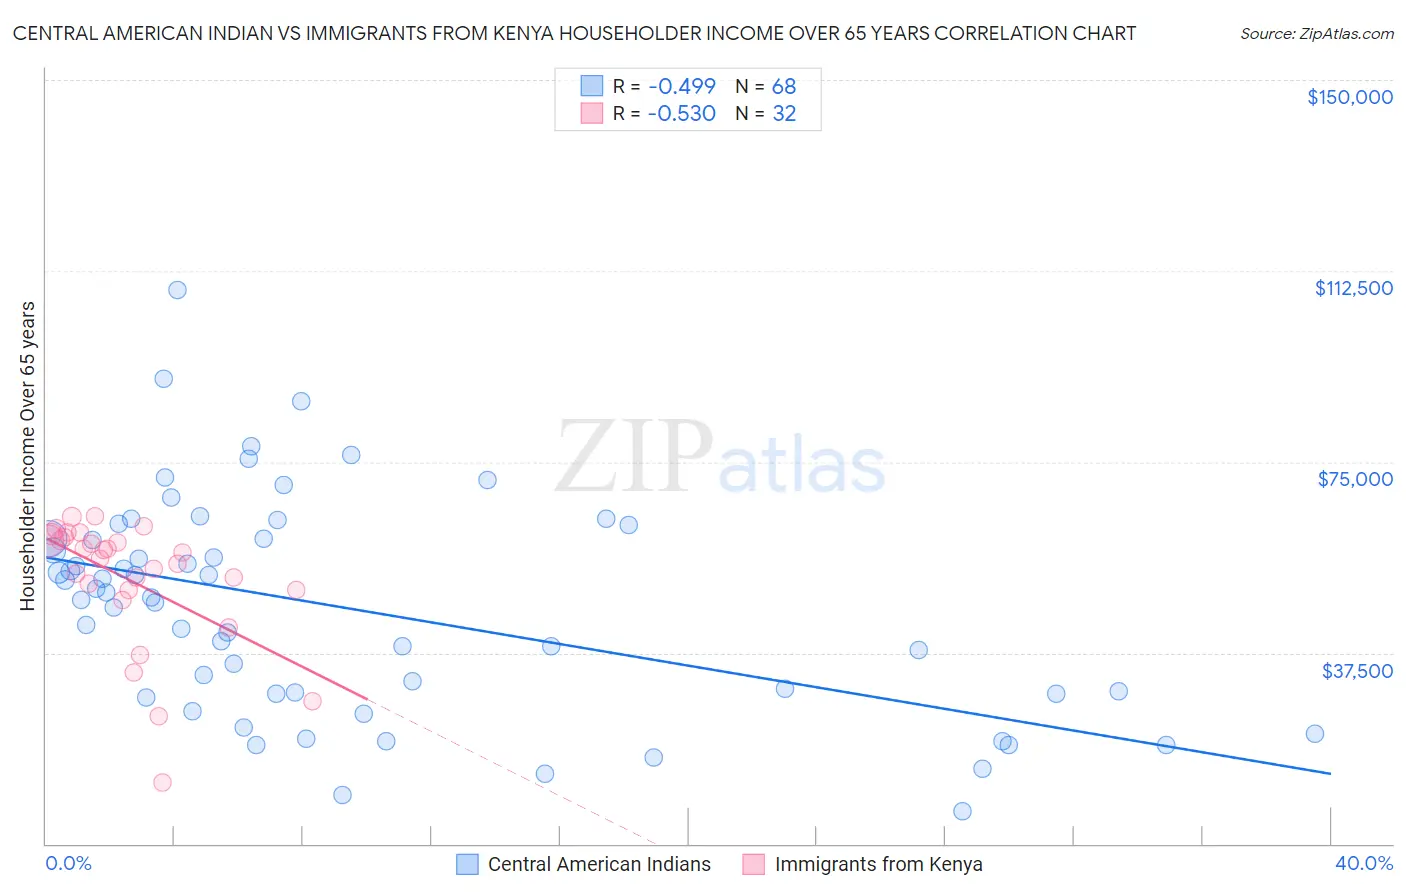
Central American Indian vs Immigrants from Kenya Householder Income Over 65 years Correlation Chart
The statistical analysis conducted on geographies consisting of 325,252,535 people shows a moderate negative correlation between the proportion of Central American Indians and household income with householder over the age of 65 in the United States with a correlation coefficient (R) of -0.499 and weighted average of $53,232. Similarly, the statistical analysis conducted on geographies consisting of 217,560,107 people shows a substantial negative correlation between the proportion of Immigrants from Kenya and household income with householder over the age of 65 in the United States with a correlation coefficient (R) of -0.530 and weighted average of $59,710, a difference of 12.2%.
Householder Income Over 65 years Correlation Summary
| Measurement | Central American Indian | Immigrants from Kenya |
| Minimum | $6,451 | $12,049 |
| Maximum | $108,875 | $64,334 |
| Range | $102,424 | $52,285 |
| Mean | $46,111 | $51,985 |
| Median | $48,148 | $56,685 |
| Interquartile 25% (IQ1) | $29,434 | $49,767 |
| Interquartile 75% (IQ3) | $59,835 | $59,847 |
| Interquartile Range (IQR) | $30,401 | $10,080 |
| Standard Deviation (Sample) | $21,274 | $12,400 |
| Standard Deviation (Population) | $21,117 | $12,205 |
Similar Demographics by Householder Income Over 65 years
Demographics Similar to Central American Indians by Householder Income Over 65 years
In terms of householder income over 65 years, the demographic groups most similar to Central American Indians are Ottawa ($53,217, a difference of 0.030%), Immigrants from Latin America ($53,265, a difference of 0.060%), Immigrants from Bahamas ($53,174, a difference of 0.11%), Immigrants from Somalia ($53,333, a difference of 0.19%), and Yuman ($53,110, a difference of 0.23%).
| Demographics | Rating | Rank | Householder Income Over 65 years |
| Africans | 0.0 /100 | #291 | Tragic $53,711 |
| Shoshone | 0.0 /100 | #292 | Tragic $53,681 |
| Immigrants | Belize | 0.0 /100 | #293 | Tragic $53,665 |
| Senegalese | 0.0 /100 | #294 | Tragic $53,591 |
| Immigrants | Central America | 0.0 /100 | #295 | Tragic $53,420 |
| Immigrants | Somalia | 0.0 /100 | #296 | Tragic $53,333 |
| Immigrants | Latin America | 0.0 /100 | #297 | Tragic $53,265 |
| Central American Indians | 0.0 /100 | #298 | Tragic $53,232 |
| Ottawa | 0.0 /100 | #299 | Tragic $53,217 |
| Immigrants | Bahamas | 0.0 /100 | #300 | Tragic $53,174 |
| Yuman | 0.0 /100 | #301 | Tragic $53,110 |
| Spanish American Indians | 0.0 /100 | #302 | Tragic $53,077 |
| Choctaw | 0.0 /100 | #303 | Tragic $53,060 |
| Ute | 0.0 /100 | #304 | Tragic $52,949 |
| Pueblo | 0.0 /100 | #305 | Tragic $52,930 |
Demographics Similar to Immigrants from Kenya by Householder Income Over 65 years
In terms of householder income over 65 years, the demographic groups most similar to Immigrants from Kenya are German ($59,730, a difference of 0.030%), Moroccan ($59,683, a difference of 0.040%), Immigrants ($59,656, a difference of 0.090%), French ($59,656, a difference of 0.090%), and Immigrants from Iraq ($59,824, a difference of 0.19%).
| Demographics | Rating | Rank | Householder Income Over 65 years |
| Puget Sound Salish | 25.3 /100 | #190 | Fair $59,934 |
| Belgians | 24.9 /100 | #191 | Fair $59,915 |
| South Americans | 23.8 /100 | #192 | Fair $59,854 |
| Immigrants | Costa Rica | 23.6 /100 | #193 | Fair $59,848 |
| Immigrants | Africa | 23.4 /100 | #194 | Fair $59,837 |
| Immigrants | Iraq | 23.2 /100 | #195 | Fair $59,824 |
| Germans | 21.5 /100 | #196 | Fair $59,730 |
| Immigrants | Kenya | 21.1 /100 | #197 | Fair $59,710 |
| Moroccans | 20.7 /100 | #198 | Fair $59,683 |
| Immigrants | Immigrants | 20.2 /100 | #199 | Fair $59,656 |
| French | 20.2 /100 | #200 | Fair $59,656 |
| Dutch | 18.3 /100 | #201 | Poor $59,539 |
| Finns | 18.2 /100 | #202 | Poor $59,535 |
| Scotch-Irish | 16.9 /100 | #203 | Poor $59,447 |
| Arapaho | 16.0 /100 | #204 | Poor $59,383 |