Slavic vs Native/Alaskan Householder Income Over 65 years
COMPARE
Slavic
Native/Alaskan
Householder Income Over 65 years
Householder Income Over 65 years Comparison
Slavs
Natives/Alaskans
$61,709
HOUSEHOLDER INCOME OVER 65 YEARS
68.5/ 100
METRIC RATING
150th/ 347
METRIC RANK
$52,081
HOUSEHOLDER INCOME OVER 65 YEARS
0.0/ 100
METRIC RATING
314th/ 347
METRIC RANK
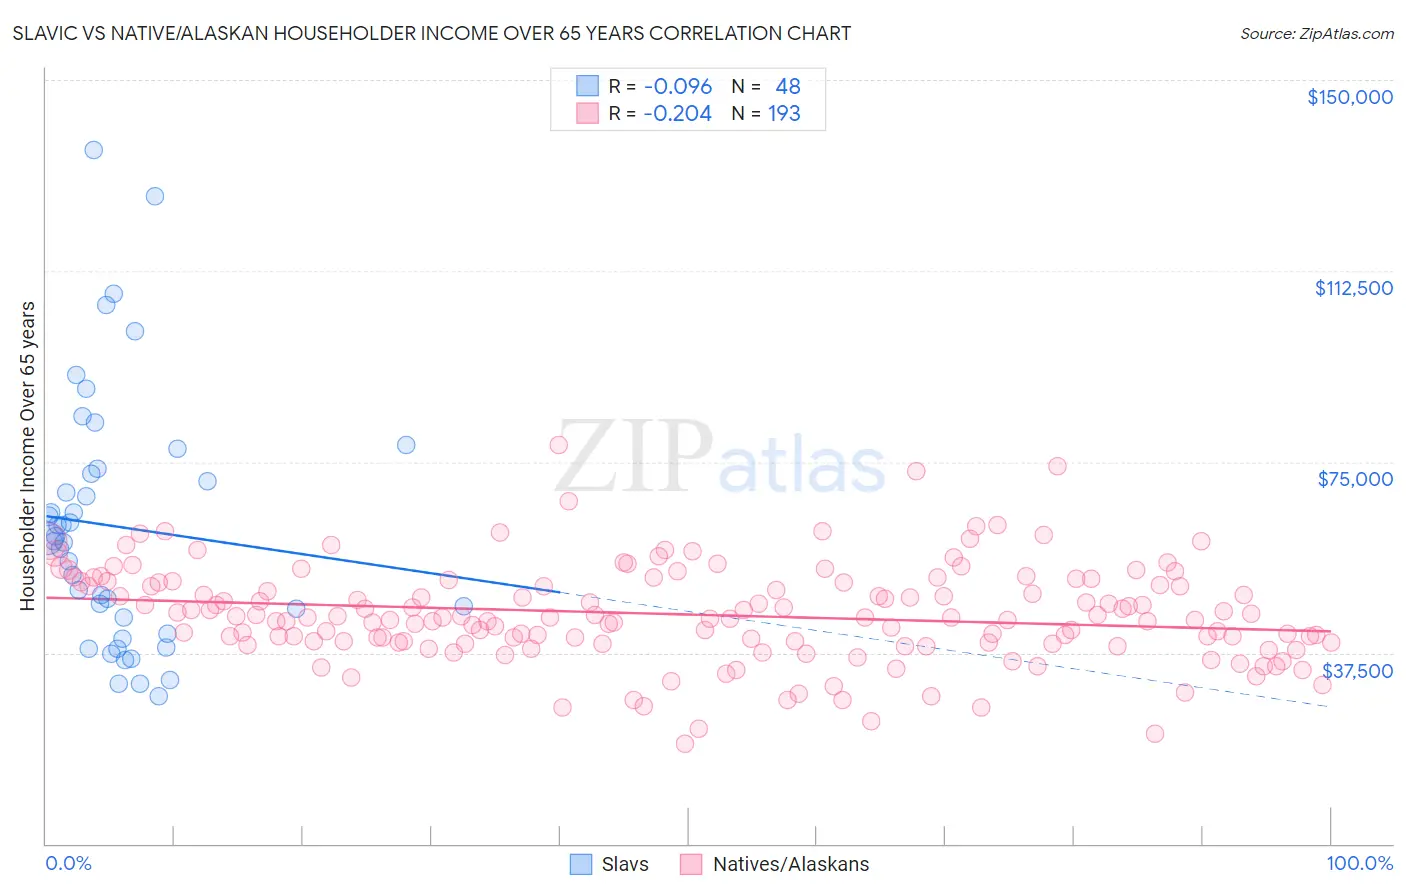
Slavic vs Native/Alaskan Householder Income Over 65 years Correlation Chart
The statistical analysis conducted on geographies consisting of 270,416,943 people shows a slight negative correlation between the proportion of Slavs and household income with householder over the age of 65 in the United States with a correlation coefficient (R) of -0.096 and weighted average of $61,709. Similarly, the statistical analysis conducted on geographies consisting of 509,572,105 people shows a weak negative correlation between the proportion of Natives/Alaskans and household income with householder over the age of 65 in the United States with a correlation coefficient (R) of -0.204 and weighted average of $52,081, a difference of 18.5%.
Householder Income Over 65 years Correlation Summary
| Measurement | Slavic | Native/Alaskan |
| Minimum | $29,063 | $19,554 |
| Maximum | $136,135 | $78,193 |
| Range | $107,072 | $58,639 |
| Mean | $62,217 | $45,041 |
| Median | $59,730 | $44,466 |
| Interquartile 25% (IQ1) | $42,874 | $39,545 |
| Interquartile 75% (IQ3) | $73,140 | $51,398 |
| Interquartile Range (IQR) | $30,267 | $11,852 |
| Standard Deviation (Sample) | $24,786 | $9,551 |
| Standard Deviation (Population) | $24,526 | $9,526 |
Similar Demographics by Householder Income Over 65 years
Demographics Similar to Slavs by Householder Income Over 65 years
In terms of householder income over 65 years, the demographic groups most similar to Slavs are Scottish ($61,735, a difference of 0.040%), Hungarian ($61,673, a difference of 0.060%), Armenian ($61,656, a difference of 0.090%), Costa Rican ($61,638, a difference of 0.12%), and Alsatian ($61,797, a difference of 0.14%).
| Demographics | Rating | Rank | Householder Income Over 65 years |
| Immigrants | Belarus | 77.8 /100 | #143 | Good $62,162 |
| Immigrants | Peru | 74.4 /100 | #144 | Good $61,988 |
| Immigrants | Uganda | 74.2 /100 | #145 | Good $61,976 |
| Immigrants | Southern Europe | 72.7 /100 | #146 | Good $61,902 |
| Immigrants | Nepal | 71.4 /100 | #147 | Good $61,843 |
| Alsatians | 70.5 /100 | #148 | Good $61,797 |
| Scottish | 69.1 /100 | #149 | Good $61,735 |
| Slavs | 68.5 /100 | #150 | Good $61,709 |
| Hungarians | 67.7 /100 | #151 | Good $61,673 |
| Armenians | 67.3 /100 | #152 | Good $61,656 |
| Costa Ricans | 66.9 /100 | #153 | Good $61,638 |
| Swiss | 66.5 /100 | #154 | Good $61,621 |
| Poles | 65.9 /100 | #155 | Good $61,598 |
| Scandinavians | 65.6 /100 | #156 | Good $61,586 |
| Macedonians | 65.1 /100 | #157 | Good $61,564 |
Demographics Similar to Natives/Alaskans by Householder Income Over 65 years
In terms of householder income over 65 years, the demographic groups most similar to Natives/Alaskans are Immigrants from Nicaragua ($52,085, a difference of 0.010%), U.S. Virgin Islander ($52,072, a difference of 0.020%), Immigrants from the Azores ($52,121, a difference of 0.080%), Creek ($51,949, a difference of 0.25%), and Immigrants from St. Vincent and the Grenadines ($51,922, a difference of 0.30%).
| Demographics | Rating | Rank | Householder Income Over 65 years |
| Hispanics or Latinos | 0.0 /100 | #307 | Tragic $52,832 |
| Immigrants | Mexico | 0.0 /100 | #308 | Tragic $52,801 |
| Hondurans | 0.0 /100 | #309 | Tragic $52,634 |
| Sioux | 0.0 /100 | #310 | Tragic $52,509 |
| Seminole | 0.0 /100 | #311 | Tragic $52,373 |
| Immigrants | Azores | 0.0 /100 | #312 | Tragic $52,121 |
| Immigrants | Nicaragua | 0.0 /100 | #313 | Tragic $52,085 |
| Natives/Alaskans | 0.0 /100 | #314 | Tragic $52,081 |
| U.S. Virgin Islanders | 0.0 /100 | #315 | Tragic $52,072 |
| Creek | 0.0 /100 | #316 | Tragic $51,949 |
| Immigrants | St. Vincent and the Grenadines | 0.0 /100 | #317 | Tragic $51,922 |
| Haitians | 0.0 /100 | #318 | Tragic $51,912 |
| Immigrants | Honduras | 0.0 /100 | #319 | Tragic $51,888 |
| Colville | 0.0 /100 | #320 | Tragic $51,739 |
| Menominee | 0.0 /100 | #321 | Tragic $51,719 |