Central American Indian vs South African Householder Income Over 65 years
COMPARE
Central American Indian
South African
Householder Income Over 65 years
Householder Income Over 65 years Comparison
Central American Indians
South Africans
$53,232
HOUSEHOLDER INCOME OVER 65 YEARS
0.0/ 100
METRIC RATING
298th/ 347
METRIC RANK
$65,652
HOUSEHOLDER INCOME OVER 65 YEARS
99.3/ 100
METRIC RATING
66th/ 347
METRIC RANK
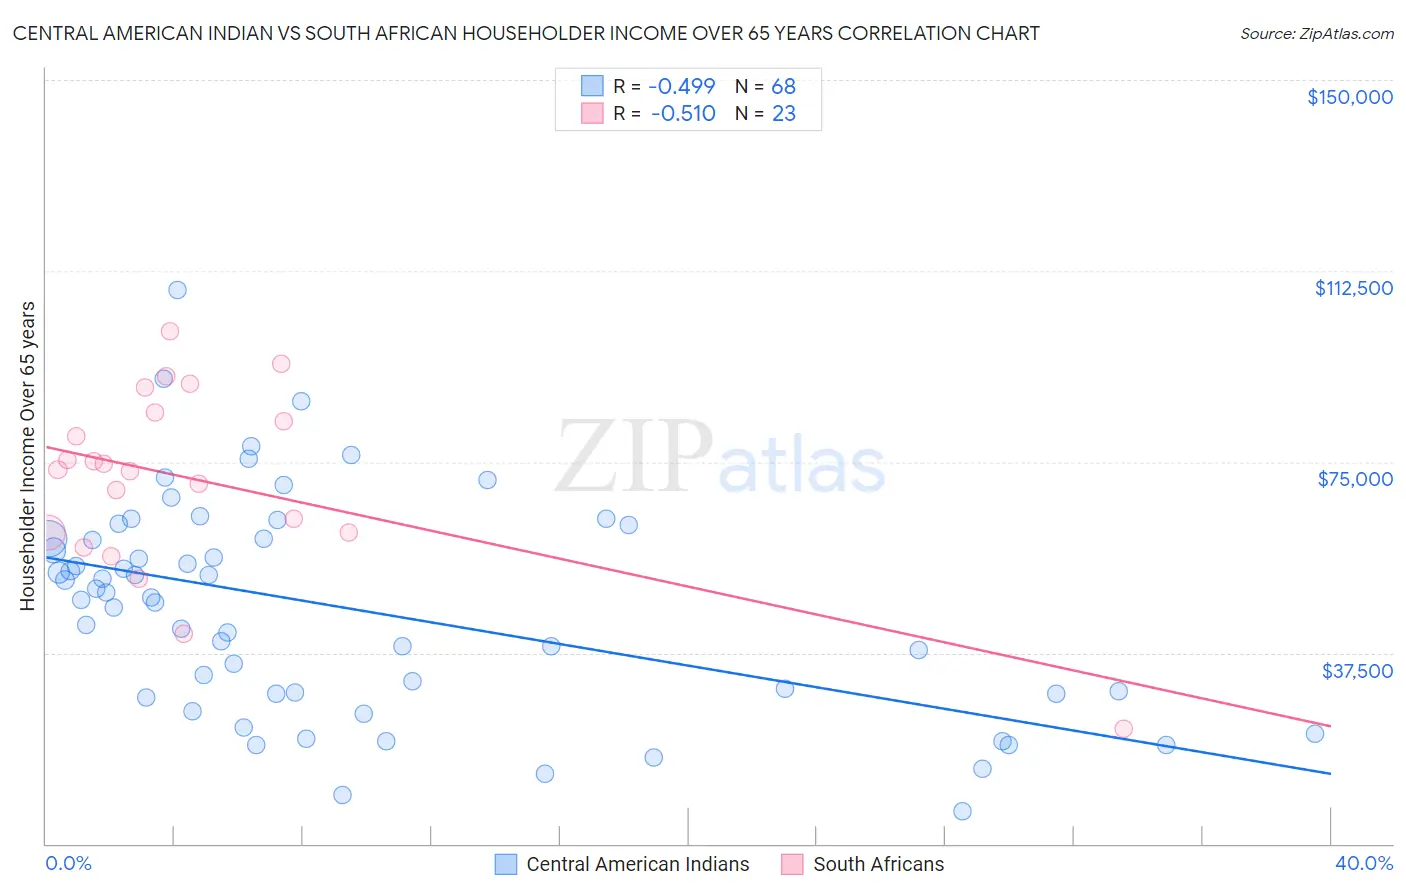
Central American Indian vs South African Householder Income Over 65 years Correlation Chart
The statistical analysis conducted on geographies consisting of 325,252,535 people shows a moderate negative correlation between the proportion of Central American Indians and household income with householder over the age of 65 in the United States with a correlation coefficient (R) of -0.499 and weighted average of $53,232. Similarly, the statistical analysis conducted on geographies consisting of 182,279,663 people shows a substantial negative correlation between the proportion of South Africans and household income with householder over the age of 65 in the United States with a correlation coefficient (R) of -0.510 and weighted average of $65,652, a difference of 23.3%.
Householder Income Over 65 years Correlation Summary
| Measurement | Central American Indian | South African |
| Minimum | $6,451 | $22,500 |
| Maximum | $108,875 | $100,655 |
| Range | $102,424 | $78,155 |
| Mean | $46,111 | $71,429 |
| Median | $48,148 | $73,431 |
| Interquartile 25% (IQ1) | $29,434 | $61,016 |
| Interquartile 75% (IQ3) | $59,835 | $84,692 |
| Interquartile Range (IQR) | $30,401 | $23,677 |
| Standard Deviation (Sample) | $21,274 | $18,184 |
| Standard Deviation (Population) | $21,117 | $17,784 |
Similar Demographics by Householder Income Over 65 years
Demographics Similar to Central American Indians by Householder Income Over 65 years
In terms of householder income over 65 years, the demographic groups most similar to Central American Indians are Ottawa ($53,217, a difference of 0.030%), Immigrants from Latin America ($53,265, a difference of 0.060%), Immigrants from Bahamas ($53,174, a difference of 0.11%), Immigrants from Somalia ($53,333, a difference of 0.19%), and Yuman ($53,110, a difference of 0.23%).
| Demographics | Rating | Rank | Householder Income Over 65 years |
| Africans | 0.0 /100 | #291 | Tragic $53,711 |
| Shoshone | 0.0 /100 | #292 | Tragic $53,681 |
| Immigrants | Belize | 0.0 /100 | #293 | Tragic $53,665 |
| Senegalese | 0.0 /100 | #294 | Tragic $53,591 |
| Immigrants | Central America | 0.0 /100 | #295 | Tragic $53,420 |
| Immigrants | Somalia | 0.0 /100 | #296 | Tragic $53,333 |
| Immigrants | Latin America | 0.0 /100 | #297 | Tragic $53,265 |
| Central American Indians | 0.0 /100 | #298 | Tragic $53,232 |
| Ottawa | 0.0 /100 | #299 | Tragic $53,217 |
| Immigrants | Bahamas | 0.0 /100 | #300 | Tragic $53,174 |
| Yuman | 0.0 /100 | #301 | Tragic $53,110 |
| Spanish American Indians | 0.0 /100 | #302 | Tragic $53,077 |
| Choctaw | 0.0 /100 | #303 | Tragic $53,060 |
| Ute | 0.0 /100 | #304 | Tragic $52,949 |
| Pueblo | 0.0 /100 | #305 | Tragic $52,930 |
Demographics Similar to South Africans by Householder Income Over 65 years
In terms of householder income over 65 years, the demographic groups most similar to South Africans are Immigrants from England ($65,715, a difference of 0.10%), Immigrants from Malaysia ($65,497, a difference of 0.24%), Zimbabwean ($65,854, a difference of 0.31%), Egyptian ($65,441, a difference of 0.32%), and Marshallese ($65,874, a difference of 0.34%).
| Demographics | Rating | Rank | Householder Income Over 65 years |
| Immigrants | Norway | 99.5 /100 | #59 | Exceptional $66,118 |
| Immigrants | Lithuania | 99.5 /100 | #60 | Exceptional $66,087 |
| Maltese | 99.5 /100 | #61 | Exceptional $66,027 |
| Immigrants | Sierra Leone | 99.5 /100 | #62 | Exceptional $66,009 |
| Marshallese | 99.4 /100 | #63 | Exceptional $65,874 |
| Zimbabweans | 99.4 /100 | #64 | Exceptional $65,854 |
| Immigrants | England | 99.3 /100 | #65 | Exceptional $65,715 |
| South Africans | 99.3 /100 | #66 | Exceptional $65,652 |
| Immigrants | Malaysia | 99.1 /100 | #67 | Exceptional $65,497 |
| Egyptians | 99.1 /100 | #68 | Exceptional $65,441 |
| Samoans | 99.1 /100 | #69 | Exceptional $65,427 |
| Mongolians | 99.0 /100 | #70 | Exceptional $65,326 |
| Greeks | 98.9 /100 | #71 | Exceptional $65,306 |
| Argentineans | 98.9 /100 | #72 | Exceptional $65,246 |
| Immigrants | Ethiopia | 98.9 /100 | #73 | Exceptional $65,238 |