Central American Indian vs Native/Alaskan Householder Income Under 25 years
COMPARE
Central American Indian
Native/Alaskan
Householder Income Under 25 years
Householder Income Under 25 years Comparison
Central American Indians
Natives/Alaskans
$48,643
HOUSEHOLDER INCOME UNDER 25 YEARS
0.0/ 100
METRIC RATING
295th/ 347
METRIC RANK
$47,704
HOUSEHOLDER INCOME UNDER 25 YEARS
0.0/ 100
METRIC RATING
306th/ 347
METRIC RANK
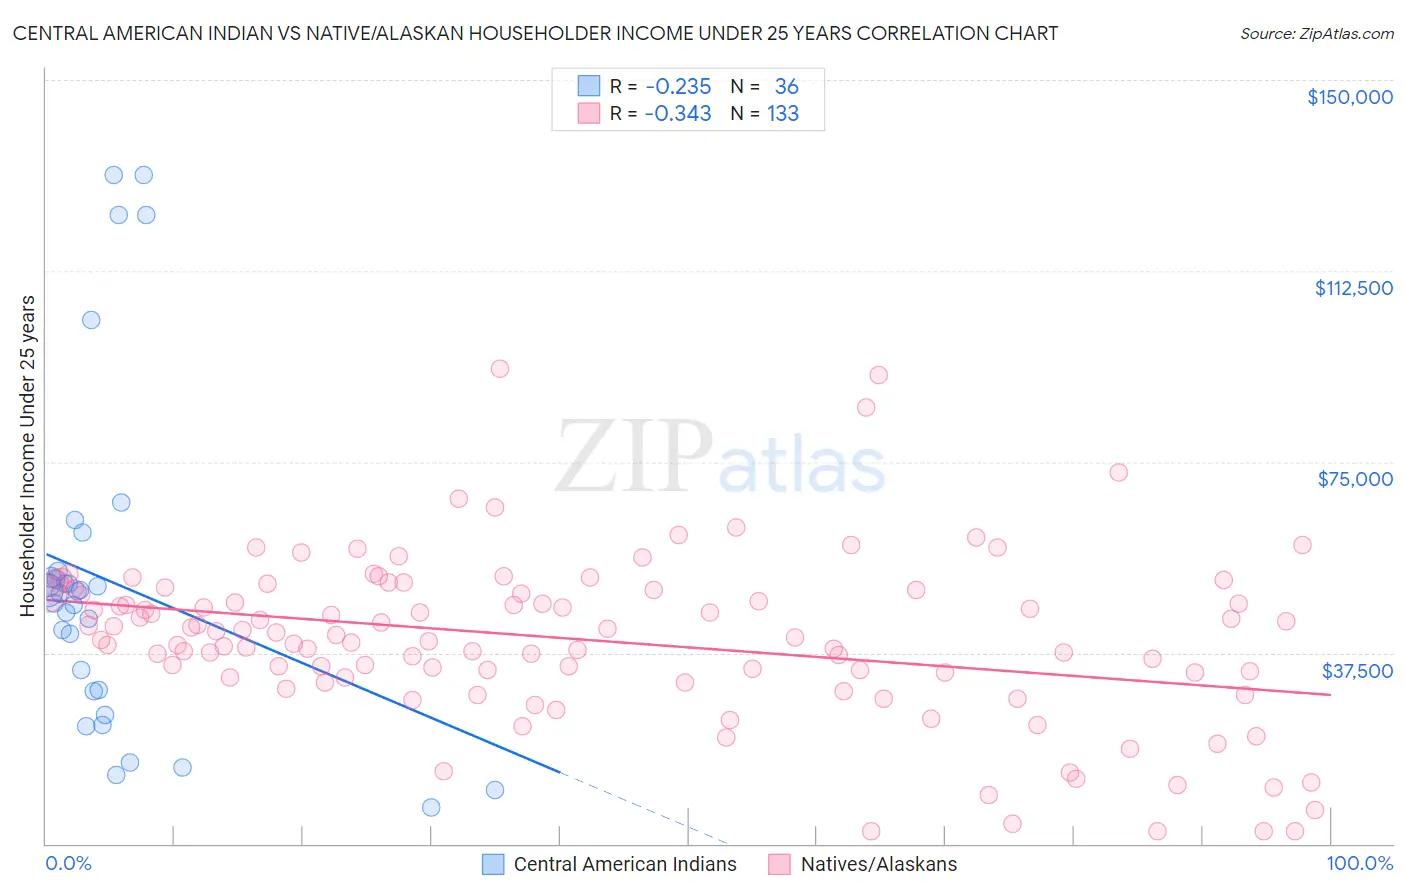
Central American Indian vs Native/Alaskan Householder Income Under 25 years Correlation Chart
The statistical analysis conducted on geographies consisting of 284,650,168 people shows a weak negative correlation between the proportion of Central American Indians and household income with householder under the age of 25 in the United States with a correlation coefficient (R) of -0.235 and weighted average of $48,643. Similarly, the statistical analysis conducted on geographies consisting of 416,135,889 people shows a mild negative correlation between the proportion of Natives/Alaskans and household income with householder under the age of 25 in the United States with a correlation coefficient (R) of -0.343 and weighted average of $47,704, a difference of 2.0%.
Householder Income Under 25 years Correlation Summary
| Measurement | Central American Indian | Native/Alaskan |
| Minimum | $7,000 | $2,499 |
| Maximum | $131,250 | $93,365 |
| Range | $124,250 | $90,866 |
| Mean | $51,609 | $40,011 |
| Median | $49,361 | $40,469 |
| Interquartile 25% (IQ1) | $29,986 | $32,640 |
| Interquartile 75% (IQ3) | $52,889 | $49,547 |
| Interquartile Range (IQR) | $22,903 | $16,907 |
| Standard Deviation (Sample) | $32,843 | $16,339 |
| Standard Deviation (Population) | $32,383 | $16,277 |
Demographics Similar to Central American Indians and Natives/Alaskans by Householder Income Under 25 years
In terms of householder income under 25 years, the demographic groups most similar to Central American Indians are Somali ($48,657, a difference of 0.030%), Blackfeet ($48,603, a difference of 0.080%), Subsaharan African ($48,691, a difference of 0.10%), Shoshone ($48,720, a difference of 0.16%), and Immigrants from Burma/Myanmar ($48,749, a difference of 0.22%). Similarly, the demographic groups most similar to Natives/Alaskans are Bangladeshi ($47,589, a difference of 0.24%), Cherokee ($47,848, a difference of 0.30%), Comanche ($47,518, a difference of 0.39%), Menominee ($47,907, a difference of 0.43%), and Immigrants from Middle Africa ($47,916, a difference of 0.44%).
| Demographics | Rating | Rank | Householder Income Under 25 years |
| Americans | 0.0 /100 | #290 | Tragic $48,860 |
| Immigrants | Burma/Myanmar | 0.0 /100 | #291 | Tragic $48,749 |
| Shoshone | 0.0 /100 | #292 | Tragic $48,720 |
| Sub-Saharan Africans | 0.0 /100 | #293 | Tragic $48,691 |
| Somalis | 0.0 /100 | #294 | Tragic $48,657 |
| Central American Indians | 0.0 /100 | #295 | Tragic $48,643 |
| Blackfeet | 0.0 /100 | #296 | Tragic $48,603 |
| Cree | 0.0 /100 | #297 | Tragic $48,514 |
| Yaqui | 0.0 /100 | #298 | Tragic $48,300 |
| Immigrants | Honduras | 0.0 /100 | #299 | Tragic $48,267 |
| Immigrants | Somalia | 0.0 /100 | #300 | Tragic $48,135 |
| Immigrants | Kuwait | 0.0 /100 | #301 | Tragic $48,126 |
| Immigrants | Liberia | 0.0 /100 | #302 | Tragic $47,981 |
| Immigrants | Middle Africa | 0.0 /100 | #303 | Tragic $47,916 |
| Menominee | 0.0 /100 | #304 | Tragic $47,907 |
| Cherokee | 0.0 /100 | #305 | Tragic $47,848 |
| Natives/Alaskans | 0.0 /100 | #306 | Tragic $47,704 |
| Bangladeshis | 0.0 /100 | #307 | Tragic $47,589 |
| Comanche | 0.0 /100 | #308 | Tragic $47,518 |
| U.S. Virgin Islanders | 0.0 /100 | #309 | Tragic $47,448 |
| Iroquois | 0.0 /100 | #310 | Tragic $47,380 |