Immigrants from Southern Europe vs Syrian Median Earnings
COMPARE
Immigrants from Southern Europe
Syrian
Median Earnings
Median Earnings Comparison
Immigrants from Southern Europe
Syrians
$50,280
MEDIAN EARNINGS
99.6/ 100
METRIC RATING
81st/ 347
METRIC RANK
$48,934
MEDIAN EARNINGS
97.1/ 100
METRIC RATING
109th/ 347
METRIC RANK
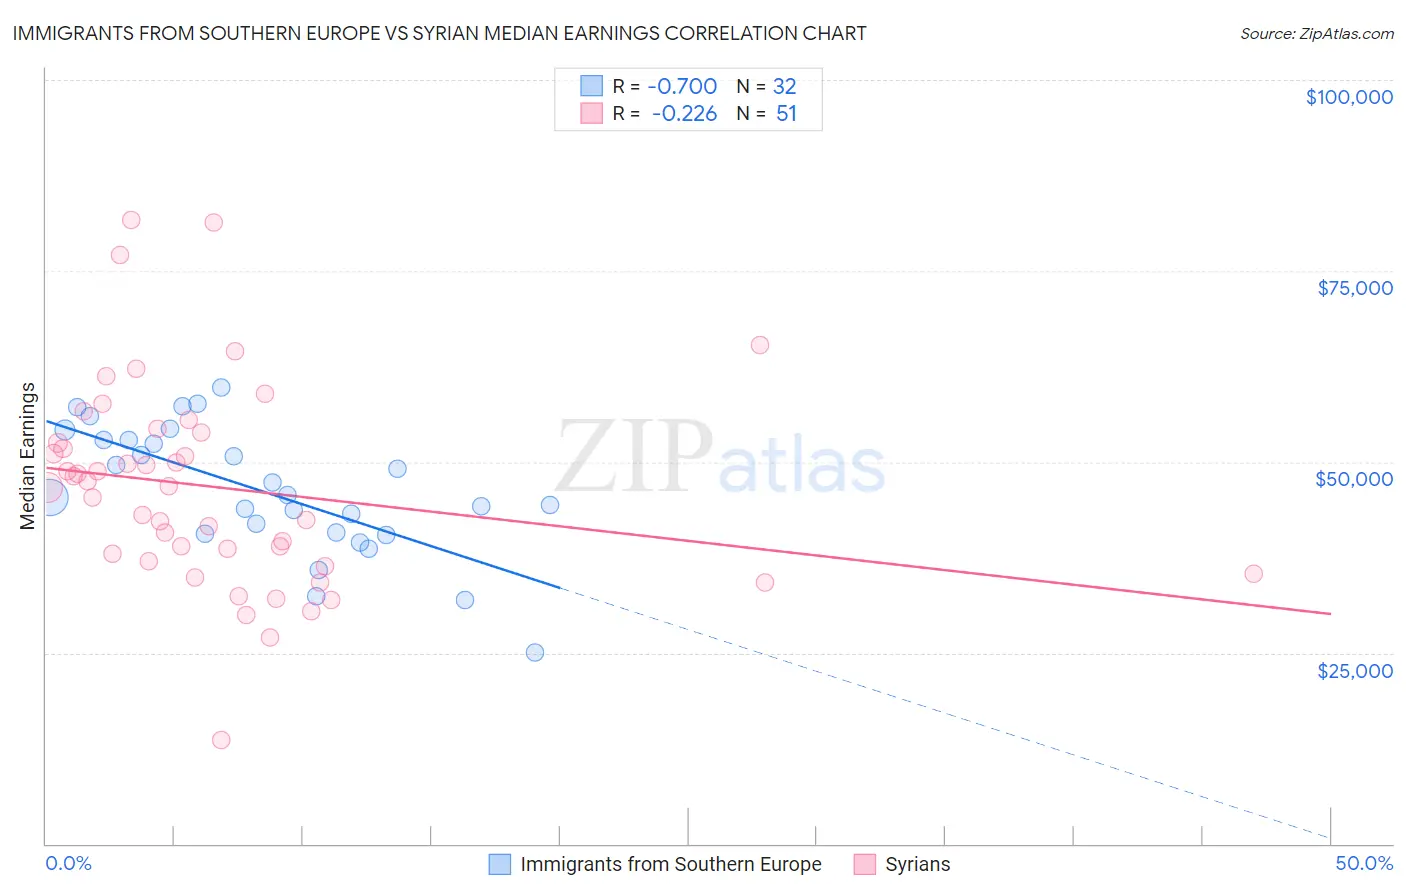
Immigrants from Southern Europe vs Syrian Median Earnings Correlation Chart
The statistical analysis conducted on geographies consisting of 402,763,457 people shows a significant negative correlation between the proportion of Immigrants from Southern Europe and median earnings in the United States with a correlation coefficient (R) of -0.700 and weighted average of $50,280. Similarly, the statistical analysis conducted on geographies consisting of 266,312,508 people shows a weak negative correlation between the proportion of Syrians and median earnings in the United States with a correlation coefficient (R) of -0.226 and weighted average of $48,934, a difference of 2.8%.
Median Earnings Correlation Summary
| Measurement | Immigrants from Southern Europe | Syrian |
| Minimum | $25,046 | $13,611 |
| Maximum | $59,687 | $81,610 |
| Range | $34,641 | $67,999 |
| Mean | $46,213 | $46,643 |
| Median | $45,445 | $46,804 |
| Interquartile 25% (IQ1) | $40,648 | $37,007 |
| Interquartile 75% (IQ3) | $52,864 | $53,802 |
| Interquartile Range (IQR) | $12,216 | $16,795 |
| Standard Deviation (Sample) | $8,358 | $13,425 |
| Standard Deviation (Population) | $8,227 | $13,293 |
Similar Demographics by Median Earnings
Demographics Similar to Immigrants from Southern Europe by Median Earnings
In terms of median earnings, the demographic groups most similar to Immigrants from Southern Europe are Immigrants from Moldova ($50,274, a difference of 0.010%), Romanian ($50,244, a difference of 0.070%), Ukrainian ($50,320, a difference of 0.080%), Immigrants from Hungary ($50,227, a difference of 0.11%), and Immigrants from Kazakhstan ($50,225, a difference of 0.11%).
| Demographics | Rating | Rank | Median Earnings |
| South Africans | 99.8 /100 | #74 | Exceptional $50,752 |
| Immigrants | Scotland | 99.8 /100 | #75 | Exceptional $50,741 |
| Immigrants | Italy | 99.7 /100 | #76 | Exceptional $50,581 |
| Immigrants | Western Europe | 99.7 /100 | #77 | Exceptional $50,549 |
| Argentineans | 99.6 /100 | #78 | Exceptional $50,399 |
| Laotians | 99.6 /100 | #79 | Exceptional $50,343 |
| Ukrainians | 99.6 /100 | #80 | Exceptional $50,320 |
| Immigrants | Southern Europe | 99.6 /100 | #81 | Exceptional $50,280 |
| Immigrants | Moldova | 99.5 /100 | #82 | Exceptional $50,274 |
| Romanians | 99.5 /100 | #83 | Exceptional $50,244 |
| Immigrants | Hungary | 99.5 /100 | #84 | Exceptional $50,227 |
| Immigrants | Kazakhstan | 99.5 /100 | #85 | Exceptional $50,225 |
| Immigrants | Canada | 99.5 /100 | #86 | Exceptional $50,192 |
| Immigrants | Uzbekistan | 99.5 /100 | #87 | Exceptional $50,151 |
| Albanians | 99.4 /100 | #88 | Exceptional $50,116 |
Demographics Similar to Syrians by Median Earnings
In terms of median earnings, the demographic groups most similar to Syrians are Immigrants from Ethiopia ($48,924, a difference of 0.020%), Immigrants from Zimbabwe ($48,913, a difference of 0.040%), Northern European ($48,887, a difference of 0.10%), Immigrants from Kuwait ($48,861, a difference of 0.15%), and Moroccan ($48,838, a difference of 0.20%).
| Demographics | Rating | Rank | Median Earnings |
| Ethiopians | 98.8 /100 | #102 | Exceptional $49,572 |
| Austrians | 98.7 /100 | #103 | Exceptional $49,501 |
| Immigrants | Brazil | 98.6 /100 | #104 | Exceptional $49,463 |
| Immigrants | Western Asia | 98.4 /100 | #105 | Exceptional $49,389 |
| Immigrants | Albania | 98.4 /100 | #106 | Exceptional $49,377 |
| Immigrants | Morocco | 98.4 /100 | #107 | Exceptional $49,368 |
| Palestinians | 98.0 /100 | #108 | Exceptional $49,209 |
| Syrians | 97.1 /100 | #109 | Exceptional $48,934 |
| Immigrants | Ethiopia | 97.1 /100 | #110 | Exceptional $48,924 |
| Immigrants | Zimbabwe | 97.0 /100 | #111 | Exceptional $48,913 |
| Northern Europeans | 96.9 /100 | #112 | Exceptional $48,887 |
| Immigrants | Kuwait | 96.8 /100 | #113 | Exceptional $48,861 |
| Moroccans | 96.7 /100 | #114 | Exceptional $48,838 |
| Chinese | 96.7 /100 | #115 | Exceptional $48,836 |
| Koreans | 96.2 /100 | #116 | Exceptional $48,727 |