Immigrants from Jordan vs Syrian Median Earnings
COMPARE
Immigrants from Jordan
Syrian
Median Earnings
Median Earnings Comparison
Immigrants from Jordan
Syrians
$48,673
MEDIAN EARNINGS
95.9/ 100
METRIC RATING
118th/ 347
METRIC RANK
$48,934
MEDIAN EARNINGS
97.1/ 100
METRIC RATING
109th/ 347
METRIC RANK
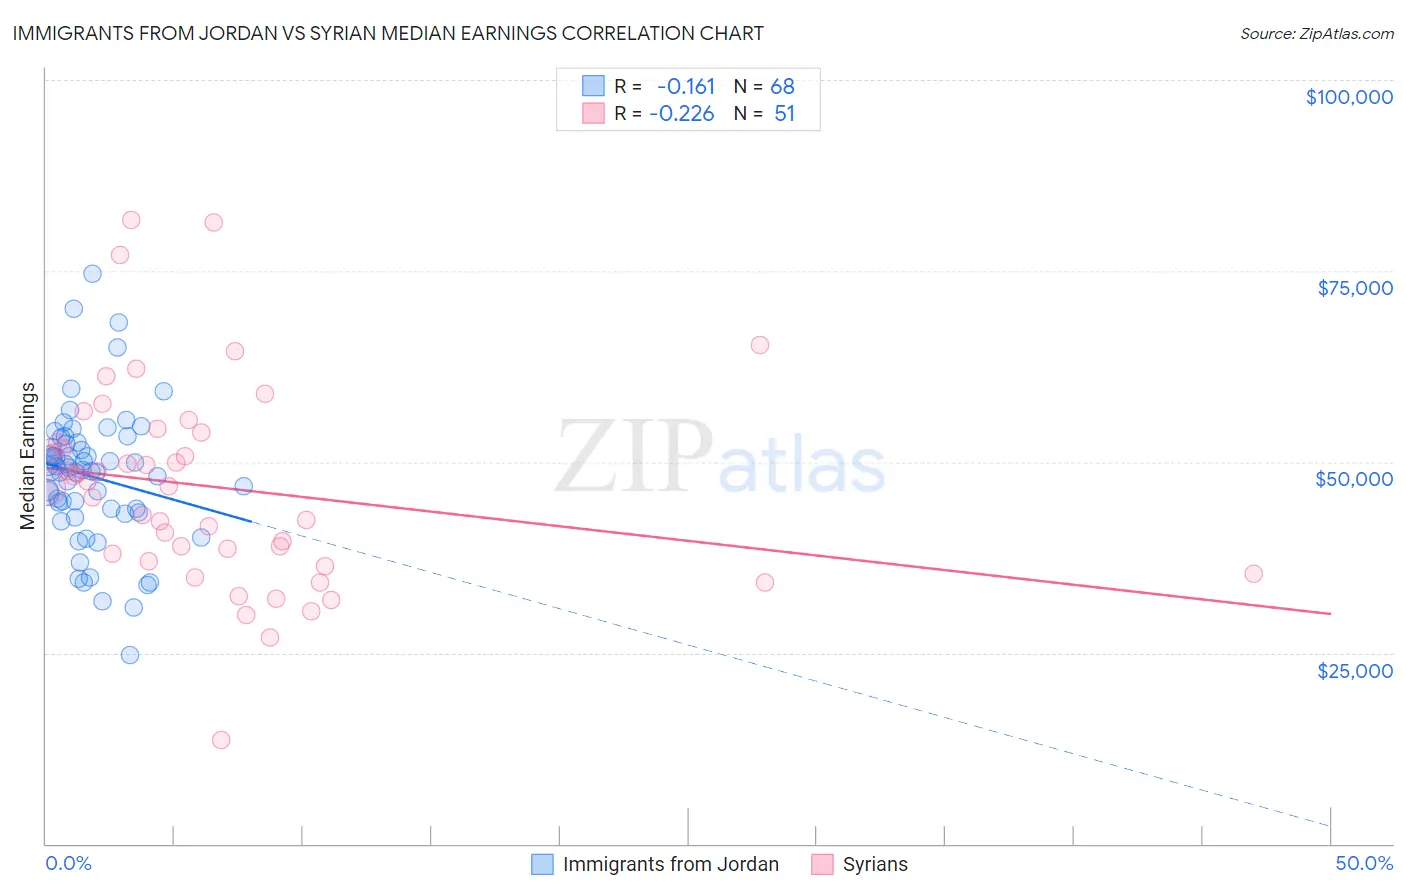
Immigrants from Jordan vs Syrian Median Earnings Correlation Chart
The statistical analysis conducted on geographies consisting of 181,245,350 people shows a poor negative correlation between the proportion of Immigrants from Jordan and median earnings in the United States with a correlation coefficient (R) of -0.161 and weighted average of $48,673. Similarly, the statistical analysis conducted on geographies consisting of 266,312,508 people shows a weak negative correlation between the proportion of Syrians and median earnings in the United States with a correlation coefficient (R) of -0.226 and weighted average of $48,934, a difference of 0.54%.
Median Earnings Correlation Summary
| Measurement | Immigrants from Jordan | Syrian |
| Minimum | $24,779 | $13,611 |
| Maximum | $74,707 | $81,610 |
| Range | $49,928 | $67,999 |
| Mean | $48,083 | $46,643 |
| Median | $48,848 | $46,804 |
| Interquartile 25% (IQ1) | $43,626 | $37,007 |
| Interquartile 75% (IQ3) | $52,401 | $53,802 |
| Interquartile Range (IQR) | $8,775 | $16,795 |
| Standard Deviation (Sample) | $8,922 | $13,425 |
| Standard Deviation (Population) | $8,857 | $13,293 |
Demographics Similar to Immigrants from Jordan and Syrians by Median Earnings
In terms of median earnings, the demographic groups most similar to Immigrants from Jordan are Serbian ($48,677, a difference of 0.010%), Polish ($48,659, a difference of 0.030%), Korean ($48,727, a difference of 0.11%), Carpatho Rusyn ($48,617, a difference of 0.11%), and Arab ($48,599, a difference of 0.15%). Similarly, the demographic groups most similar to Syrians are Immigrants from Ethiopia ($48,924, a difference of 0.020%), Immigrants from Zimbabwe ($48,913, a difference of 0.040%), Northern European ($48,887, a difference of 0.10%), Immigrants from Kuwait ($48,861, a difference of 0.15%), and Moroccan ($48,838, a difference of 0.20%).
| Demographics | Rating | Rank | Median Earnings |
| Austrians | 98.7 /100 | #103 | Exceptional $49,501 |
| Immigrants | Brazil | 98.6 /100 | #104 | Exceptional $49,463 |
| Immigrants | Western Asia | 98.4 /100 | #105 | Exceptional $49,389 |
| Immigrants | Albania | 98.4 /100 | #106 | Exceptional $49,377 |
| Immigrants | Morocco | 98.4 /100 | #107 | Exceptional $49,368 |
| Palestinians | 98.0 /100 | #108 | Exceptional $49,209 |
| Syrians | 97.1 /100 | #109 | Exceptional $48,934 |
| Immigrants | Ethiopia | 97.1 /100 | #110 | Exceptional $48,924 |
| Immigrants | Zimbabwe | 97.0 /100 | #111 | Exceptional $48,913 |
| Northern Europeans | 96.9 /100 | #112 | Exceptional $48,887 |
| Immigrants | Kuwait | 96.8 /100 | #113 | Exceptional $48,861 |
| Moroccans | 96.7 /100 | #114 | Exceptional $48,838 |
| Chinese | 96.7 /100 | #115 | Exceptional $48,836 |
| Koreans | 96.2 /100 | #116 | Exceptional $48,727 |
| Serbians | 95.9 /100 | #117 | Exceptional $48,677 |
| Immigrants | Jordan | 95.9 /100 | #118 | Exceptional $48,673 |
| Poles | 95.8 /100 | #119 | Exceptional $48,659 |
| Carpatho Rusyns | 95.5 /100 | #120 | Exceptional $48,617 |
| Arabs | 95.4 /100 | #121 | Exceptional $48,599 |
| Chileans | 94.8 /100 | #122 | Exceptional $48,504 |
| Immigrants | Syria | 93.9 /100 | #123 | Exceptional $48,375 |