Cajun vs Immigrants from Central America Householder Income Ages 45 - 64 years
COMPARE
Cajun
Immigrants from Central America
Householder Income Ages 45 - 64 years
Householder Income Ages 45 - 64 years Comparison
Cajuns
Immigrants from Central America
$83,015
HOUSEHOLDER INCOME AGES 45 - 64 YEARS
0.0/ 100
METRIC RATING
312th/ 347
METRIC RANK
$85,965
HOUSEHOLDER INCOME AGES 45 - 64 YEARS
0.1/ 100
METRIC RATING
292nd/ 347
METRIC RANK
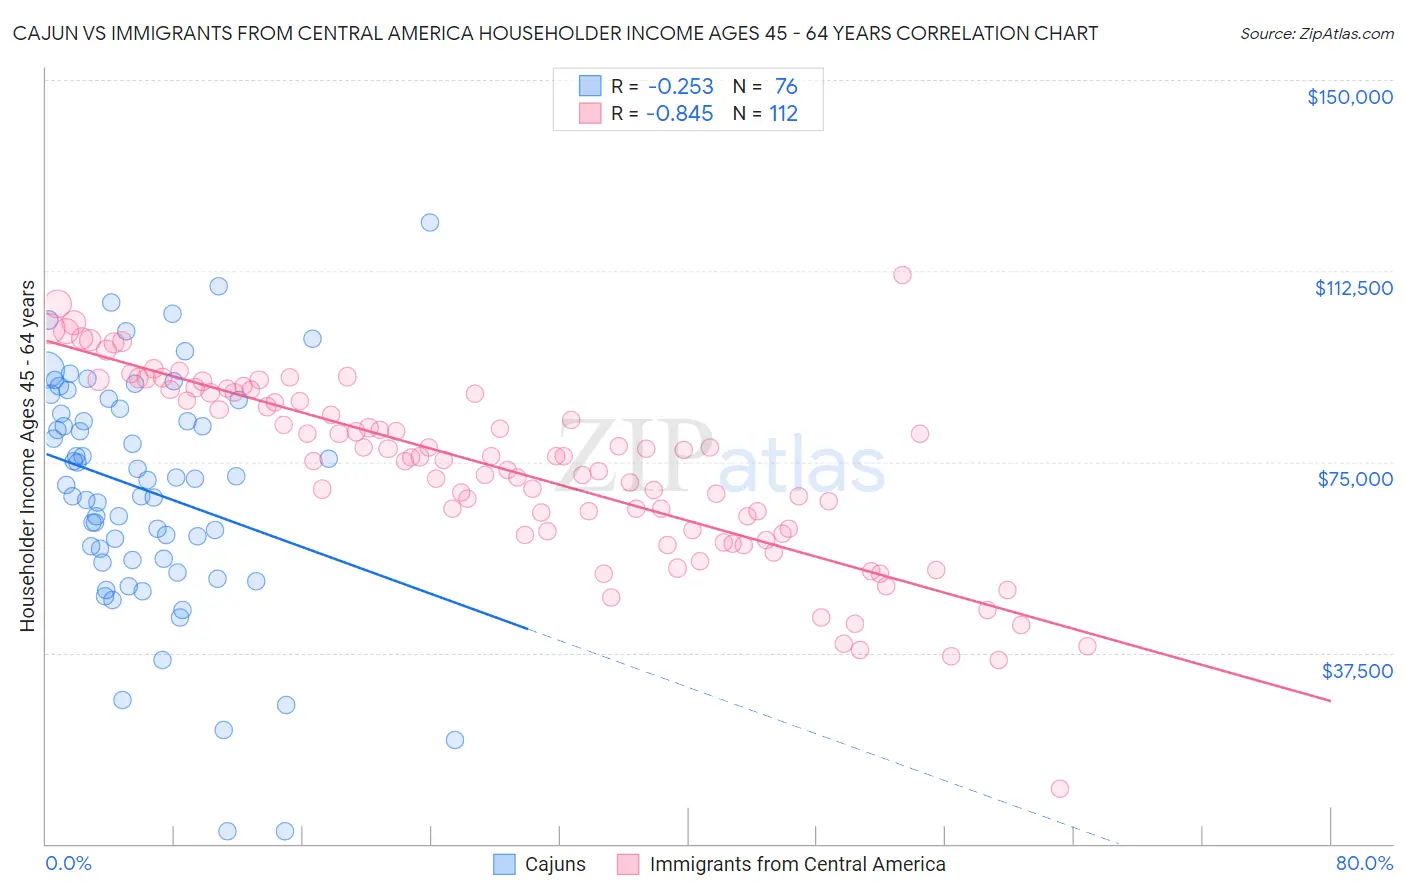
Cajun vs Immigrants from Central America Householder Income Ages 45 - 64 years Correlation Chart
The statistical analysis conducted on geographies consisting of 149,484,313 people shows a weak negative correlation between the proportion of Cajuns and household income with householder between the ages 45 and 64 in the United States with a correlation coefficient (R) of -0.253 and weighted average of $83,015. Similarly, the statistical analysis conducted on geographies consisting of 533,887,943 people shows a very strong negative correlation between the proportion of Immigrants from Central America and household income with householder between the ages 45 and 64 in the United States with a correlation coefficient (R) of -0.845 and weighted average of $85,965, a difference of 3.5%.
Householder Income Ages 45 - 64 years Correlation Summary
| Measurement | Cajun | Immigrants from Central America |
| Minimum | $2,499 | $10,788 |
| Maximum | $121,893 | $111,667 |
| Range | $119,394 | $100,879 |
| Mean | $69,425 | $73,521 |
| Median | $71,604 | $75,933 |
| Interquartile 25% (IQ1) | $55,904 | $61,476 |
| Interquartile 75% (IQ3) | $86,282 | $88,461 |
| Interquartile Range (IQR) | $30,378 | $26,985 |
| Standard Deviation (Sample) | $23,334 | $17,981 |
| Standard Deviation (Population) | $23,180 | $17,900 |
Demographics Similar to Cajuns and Immigrants from Central America by Householder Income Ages 45 - 64 years
In terms of householder income ages 45 - 64 years, the demographic groups most similar to Cajuns are Immigrants from Bahamas ($83,177, a difference of 0.20%), Immigrants from Haiti ($83,257, a difference of 0.29%), Immigrants from Dominica ($83,311, a difference of 0.36%), Immigrants from Cabo Verde ($83,542, a difference of 0.63%), and Shoshone ($83,588, a difference of 0.69%). Similarly, the demographic groups most similar to Immigrants from Central America are Comanche ($85,787, a difference of 0.21%), British West Indian ($85,571, a difference of 0.46%), Immigrants from Grenada ($85,552, a difference of 0.48%), Immigrants from Zaire ($85,207, a difference of 0.89%), and Fijian ($85,187, a difference of 0.91%).
| Demographics | Rating | Rank | Householder Income Ages 45 - 64 years |
| Immigrants | Central America | 0.1 /100 | #292 | Tragic $85,965 |
| Comanche | 0.1 /100 | #293 | Tragic $85,787 |
| British West Indians | 0.1 /100 | #294 | Tragic $85,571 |
| Immigrants | Grenada | 0.1 /100 | #295 | Tragic $85,552 |
| Immigrants | Zaire | 0.1 /100 | #296 | Tragic $85,207 |
| Fijians | 0.1 /100 | #297 | Tragic $85,187 |
| Africans | 0.0 /100 | #298 | Tragic $84,925 |
| Immigrants | Mexico | 0.0 /100 | #299 | Tragic $84,910 |
| Indonesians | 0.0 /100 | #300 | Tragic $84,890 |
| Potawatomi | 0.0 /100 | #301 | Tragic $84,613 |
| Haitians | 0.0 /100 | #302 | Tragic $84,384 |
| Hondurans | 0.0 /100 | #303 | Tragic $84,079 |
| Ottawa | 0.0 /100 | #304 | Tragic $83,953 |
| Chippewa | 0.0 /100 | #305 | Tragic $83,943 |
| Ute | 0.0 /100 | #306 | Tragic $83,937 |
| Shoshone | 0.0 /100 | #307 | Tragic $83,588 |
| Immigrants | Cabo Verde | 0.0 /100 | #308 | Tragic $83,542 |
| Immigrants | Dominica | 0.0 /100 | #309 | Tragic $83,311 |
| Immigrants | Haiti | 0.0 /100 | #310 | Tragic $83,257 |
| Immigrants | Bahamas | 0.0 /100 | #311 | Tragic $83,177 |
| Cajuns | 0.0 /100 | #312 | Tragic $83,015 |