Immigrants from Liberia vs Immigrants from Central America Householder Income Ages 45 - 64 years
COMPARE
Immigrants from Liberia
Immigrants from Central America
Householder Income Ages 45 - 64 years
Householder Income Ages 45 - 64 years Comparison
Immigrants from Liberia
Immigrants from Central America
$87,739
HOUSEHOLDER INCOME AGES 45 - 64 YEARS
0.2/ 100
METRIC RATING
270th/ 347
METRIC RANK
$85,965
HOUSEHOLDER INCOME AGES 45 - 64 YEARS
0.1/ 100
METRIC RATING
292nd/ 347
METRIC RANK
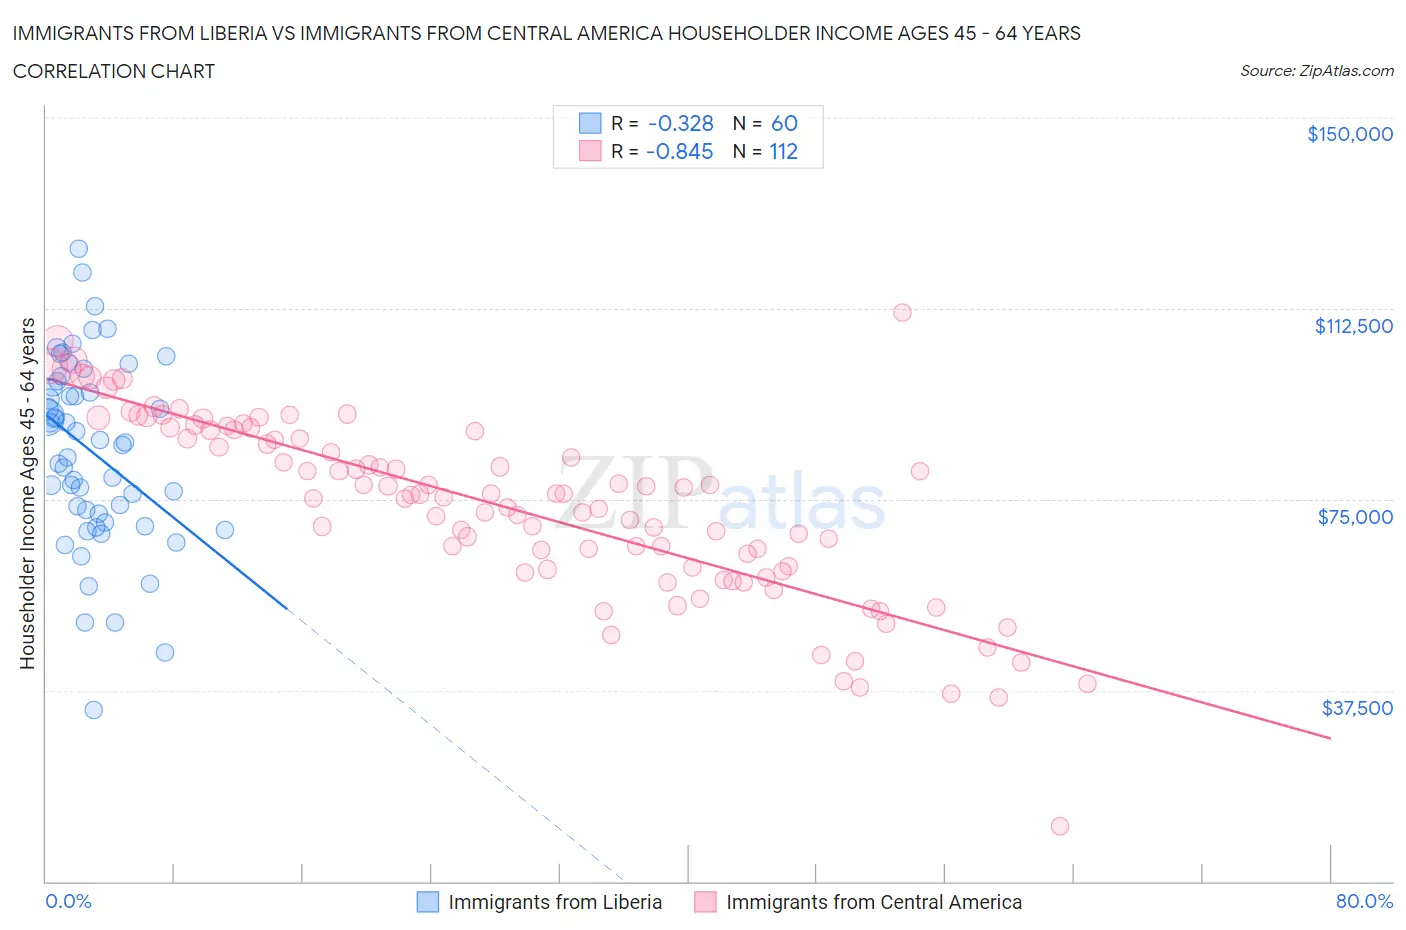
Immigrants from Liberia vs Immigrants from Central America Householder Income Ages 45 - 64 years Correlation Chart
The statistical analysis conducted on geographies consisting of 135,189,052 people shows a mild negative correlation between the proportion of Immigrants from Liberia and household income with householder between the ages 45 and 64 in the United States with a correlation coefficient (R) of -0.328 and weighted average of $87,739. Similarly, the statistical analysis conducted on geographies consisting of 533,887,943 people shows a very strong negative correlation between the proportion of Immigrants from Central America and household income with householder between the ages 45 and 64 in the United States with a correlation coefficient (R) of -0.845 and weighted average of $85,965, a difference of 2.1%.
Householder Income Ages 45 - 64 years Correlation Summary
| Measurement | Immigrants from Liberia | Immigrants from Central America |
| Minimum | $33,597 | $10,788 |
| Maximum | $124,313 | $111,667 |
| Range | $90,716 | $100,879 |
| Mean | $84,202 | $73,521 |
| Median | $85,955 | $75,933 |
| Interquartile 25% (IQ1) | $71,300 | $61,476 |
| Interquartile 75% (IQ3) | $97,673 | $88,461 |
| Interquartile Range (IQR) | $26,373 | $26,985 |
| Standard Deviation (Sample) | $18,447 | $17,981 |
| Standard Deviation (Population) | $18,293 | $17,900 |
Similar Demographics by Householder Income Ages 45 - 64 years
Demographics Similar to Immigrants from Liberia by Householder Income Ages 45 - 64 years
In terms of householder income ages 45 - 64 years, the demographic groups most similar to Immigrants from Liberia are Guatemalan ($87,705, a difference of 0.040%), Spanish American ($87,836, a difference of 0.11%), Immigrants from Micronesia ($87,864, a difference of 0.14%), Cape Verdean ($87,580, a difference of 0.18%), and Spanish American Indian ($87,561, a difference of 0.20%).
| Demographics | Rating | Rank | Householder Income Ages 45 - 64 years |
| Immigrants | Senegal | 0.3 /100 | #263 | Tragic $88,421 |
| Osage | 0.3 /100 | #264 | Tragic $88,390 |
| Jamaicans | 0.2 /100 | #265 | Tragic $88,327 |
| Immigrants | West Indies | 0.2 /100 | #266 | Tragic $88,164 |
| Hmong | 0.2 /100 | #267 | Tragic $88,115 |
| Immigrants | Micronesia | 0.2 /100 | #268 | Tragic $87,864 |
| Spanish Americans | 0.2 /100 | #269 | Tragic $87,836 |
| Immigrants | Liberia | 0.2 /100 | #270 | Tragic $87,739 |
| Guatemalans | 0.2 /100 | #271 | Tragic $87,705 |
| Cape Verdeans | 0.2 /100 | #272 | Tragic $87,580 |
| Spanish American Indians | 0.2 /100 | #273 | Tragic $87,561 |
| Iroquois | 0.1 /100 | #274 | Tragic $87,255 |
| Immigrants | Belize | 0.1 /100 | #275 | Tragic $87,229 |
| Immigrants | Latin America | 0.1 /100 | #276 | Tragic $87,219 |
| Cree | 0.1 /100 | #277 | Tragic $87,185 |
Demographics Similar to Immigrants from Central America by Householder Income Ages 45 - 64 years
In terms of householder income ages 45 - 64 years, the demographic groups most similar to Immigrants from Central America are Hispanic or Latino ($86,006, a difference of 0.050%), Cherokee ($86,125, a difference of 0.19%), Comanche ($85,787, a difference of 0.21%), Cuban ($86,301, a difference of 0.39%), and British West Indian ($85,571, a difference of 0.46%).
| Demographics | Rating | Rank | Householder Income Ages 45 - 64 years |
| Blackfeet | 0.1 /100 | #285 | Tragic $86,595 |
| Immigrants | Guatemala | 0.1 /100 | #286 | Tragic $86,573 |
| Bangladeshis | 0.1 /100 | #287 | Tragic $86,402 |
| Immigrants | St. Vincent and the Grenadines | 0.1 /100 | #288 | Tragic $86,394 |
| Cubans | 0.1 /100 | #289 | Tragic $86,301 |
| Cherokee | 0.1 /100 | #290 | Tragic $86,125 |
| Hispanics or Latinos | 0.1 /100 | #291 | Tragic $86,006 |
| Immigrants | Central America | 0.1 /100 | #292 | Tragic $85,965 |
| Comanche | 0.1 /100 | #293 | Tragic $85,787 |
| British West Indians | 0.1 /100 | #294 | Tragic $85,571 |
| Immigrants | Grenada | 0.1 /100 | #295 | Tragic $85,552 |
| Immigrants | Zaire | 0.1 /100 | #296 | Tragic $85,207 |
| Fijians | 0.1 /100 | #297 | Tragic $85,187 |
| Africans | 0.0 /100 | #298 | Tragic $84,925 |
| Immigrants | Mexico | 0.0 /100 | #299 | Tragic $84,910 |