South American vs Immigrants from Central America Householder Income Ages 45 - 64 years
COMPARE
South American
Immigrants from Central America
Householder Income Ages 45 - 64 years
Householder Income Ages 45 - 64 years Comparison
South Americans
Immigrants from Central America
$100,837
HOUSEHOLDER INCOME AGES 45 - 64 YEARS
56.4/ 100
METRIC RATING
171st/ 347
METRIC RANK
$85,965
HOUSEHOLDER INCOME AGES 45 - 64 YEARS
0.1/ 100
METRIC RATING
292nd/ 347
METRIC RANK
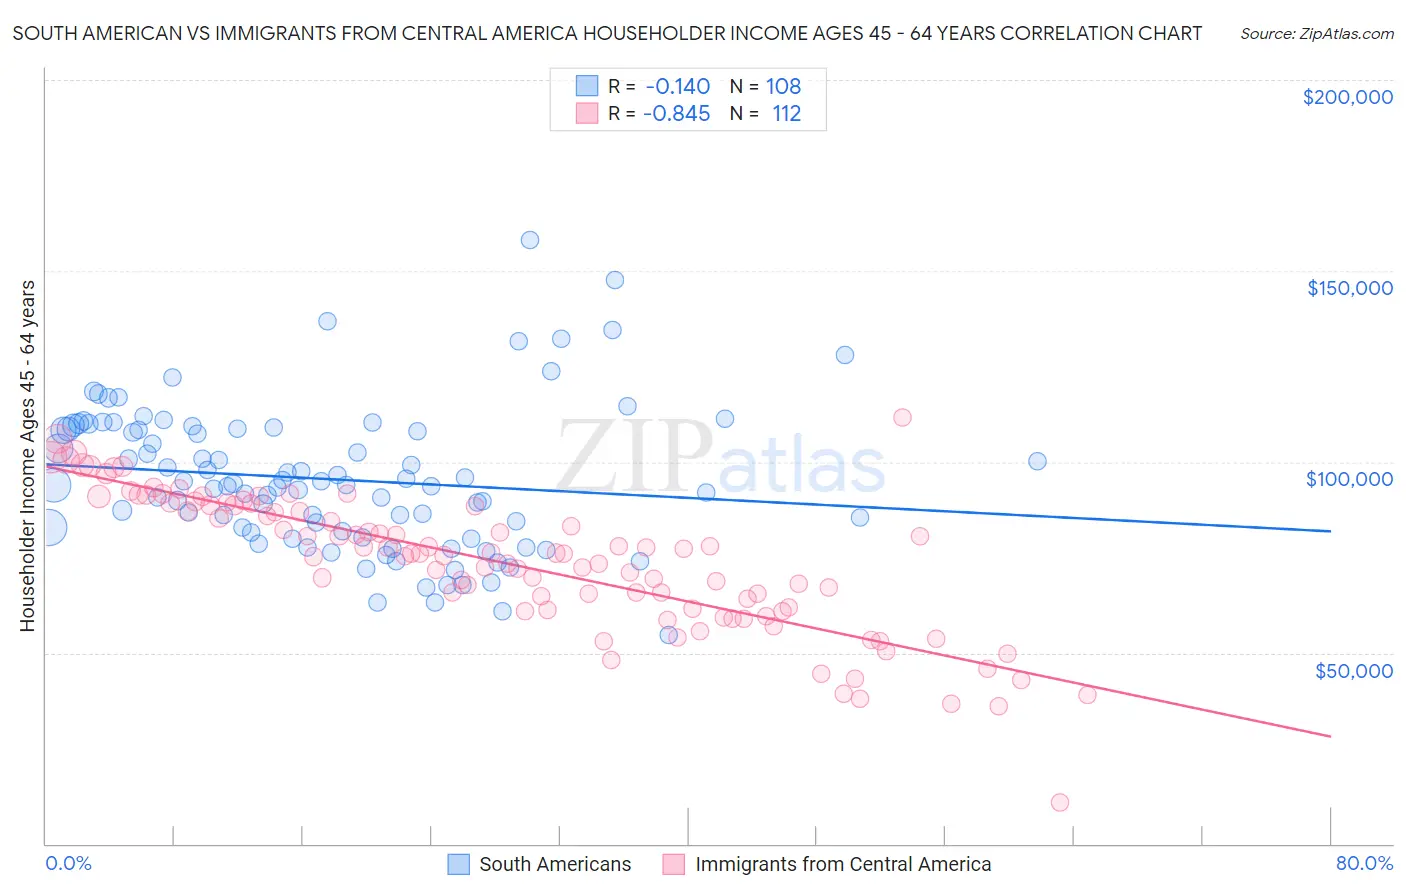
South American vs Immigrants from Central America Householder Income Ages 45 - 64 years Correlation Chart
The statistical analysis conducted on geographies consisting of 492,624,098 people shows a poor negative correlation between the proportion of South Americans and household income with householder between the ages 45 and 64 in the United States with a correlation coefficient (R) of -0.140 and weighted average of $100,837. Similarly, the statistical analysis conducted on geographies consisting of 533,887,943 people shows a very strong negative correlation between the proportion of Immigrants from Central America and household income with householder between the ages 45 and 64 in the United States with a correlation coefficient (R) of -0.845 and weighted average of $85,965, a difference of 17.3%.
Householder Income Ages 45 - 64 years Correlation Summary
| Measurement | South American | Immigrants from Central America |
| Minimum | $54,659 | $10,788 |
| Maximum | $158,009 | $111,667 |
| Range | $103,350 | $100,879 |
| Mean | $95,419 | $73,521 |
| Median | $93,921 | $75,933 |
| Interquartile 25% (IQ1) | $81,601 | $61,476 |
| Interquartile 75% (IQ3) | $108,663 | $88,461 |
| Interquartile Range (IQR) | $27,062 | $26,985 |
| Standard Deviation (Sample) | $18,909 | $17,981 |
| Standard Deviation (Population) | $18,822 | $17,900 |
Similar Demographics by Householder Income Ages 45 - 64 years
Demographics Similar to South Americans by Householder Income Ages 45 - 64 years
In terms of householder income ages 45 - 64 years, the demographic groups most similar to South Americans are Slovak ($101,029, a difference of 0.19%), Immigrants from Uzbekistan ($100,523, a difference of 0.31%), South American Indian ($101,171, a difference of 0.33%), Guamanian/Chamorro ($101,170, a difference of 0.33%), and Alsatian ($100,435, a difference of 0.40%).
| Demographics | Rating | Rank | Householder Income Ages 45 - 64 years |
| Immigrants | Morocco | 70.0 /100 | #164 | Good $102,015 |
| Immigrants | Albania | 69.4 /100 | #165 | Good $101,957 |
| Samoans | 65.3 /100 | #166 | Good $101,580 |
| Czechoslovakians | 63.0 /100 | #167 | Good $101,387 |
| South American Indians | 60.5 /100 | #168 | Good $101,171 |
| Guamanians/Chamorros | 60.5 /100 | #169 | Good $101,170 |
| Slovaks | 58.8 /100 | #170 | Average $101,029 |
| South Americans | 56.4 /100 | #171 | Average $100,837 |
| Immigrants | Uzbekistan | 52.5 /100 | #172 | Average $100,523 |
| Alsatians | 51.4 /100 | #173 | Average $100,435 |
| Welsh | 50.0 /100 | #174 | Average $100,322 |
| Germans | 48.8 /100 | #175 | Average $100,224 |
| Immigrants | Costa Rica | 47.7 /100 | #176 | Average $100,141 |
| Moroccans | 47.7 /100 | #177 | Average $100,138 |
| Immigrants | Cameroon | 47.0 /100 | #178 | Average $100,084 |
Demographics Similar to Immigrants from Central America by Householder Income Ages 45 - 64 years
In terms of householder income ages 45 - 64 years, the demographic groups most similar to Immigrants from Central America are Hispanic or Latino ($86,006, a difference of 0.050%), Cherokee ($86,125, a difference of 0.19%), Comanche ($85,787, a difference of 0.21%), Cuban ($86,301, a difference of 0.39%), and British West Indian ($85,571, a difference of 0.46%).
| Demographics | Rating | Rank | Householder Income Ages 45 - 64 years |
| Blackfeet | 0.1 /100 | #285 | Tragic $86,595 |
| Immigrants | Guatemala | 0.1 /100 | #286 | Tragic $86,573 |
| Bangladeshis | 0.1 /100 | #287 | Tragic $86,402 |
| Immigrants | St. Vincent and the Grenadines | 0.1 /100 | #288 | Tragic $86,394 |
| Cubans | 0.1 /100 | #289 | Tragic $86,301 |
| Cherokee | 0.1 /100 | #290 | Tragic $86,125 |
| Hispanics or Latinos | 0.1 /100 | #291 | Tragic $86,006 |
| Immigrants | Central America | 0.1 /100 | #292 | Tragic $85,965 |
| Comanche | 0.1 /100 | #293 | Tragic $85,787 |
| British West Indians | 0.1 /100 | #294 | Tragic $85,571 |
| Immigrants | Grenada | 0.1 /100 | #295 | Tragic $85,552 |
| Immigrants | Zaire | 0.1 /100 | #296 | Tragic $85,207 |
| Fijians | 0.1 /100 | #297 | Tragic $85,187 |
| Africans | 0.0 /100 | #298 | Tragic $84,925 |
| Immigrants | Mexico | 0.0 /100 | #299 | Tragic $84,910 |