Carpatho Rusyn vs Immigrants from Australia Householder Income Ages 45 - 64 years
COMPARE
Carpatho Rusyn
Immigrants from Australia
Householder Income Ages 45 - 64 years
Householder Income Ages 45 - 64 years Comparison
Carpatho Rusyns
Immigrants from Australia
$102,777
HOUSEHOLDER INCOME AGES 45 - 64 YEARS
77.4/ 100
METRIC RATING
156th/ 347
METRIC RANK
$119,308
HOUSEHOLDER INCOME AGES 45 - 64 YEARS
100.0/ 100
METRIC RATING
20th/ 347
METRIC RANK
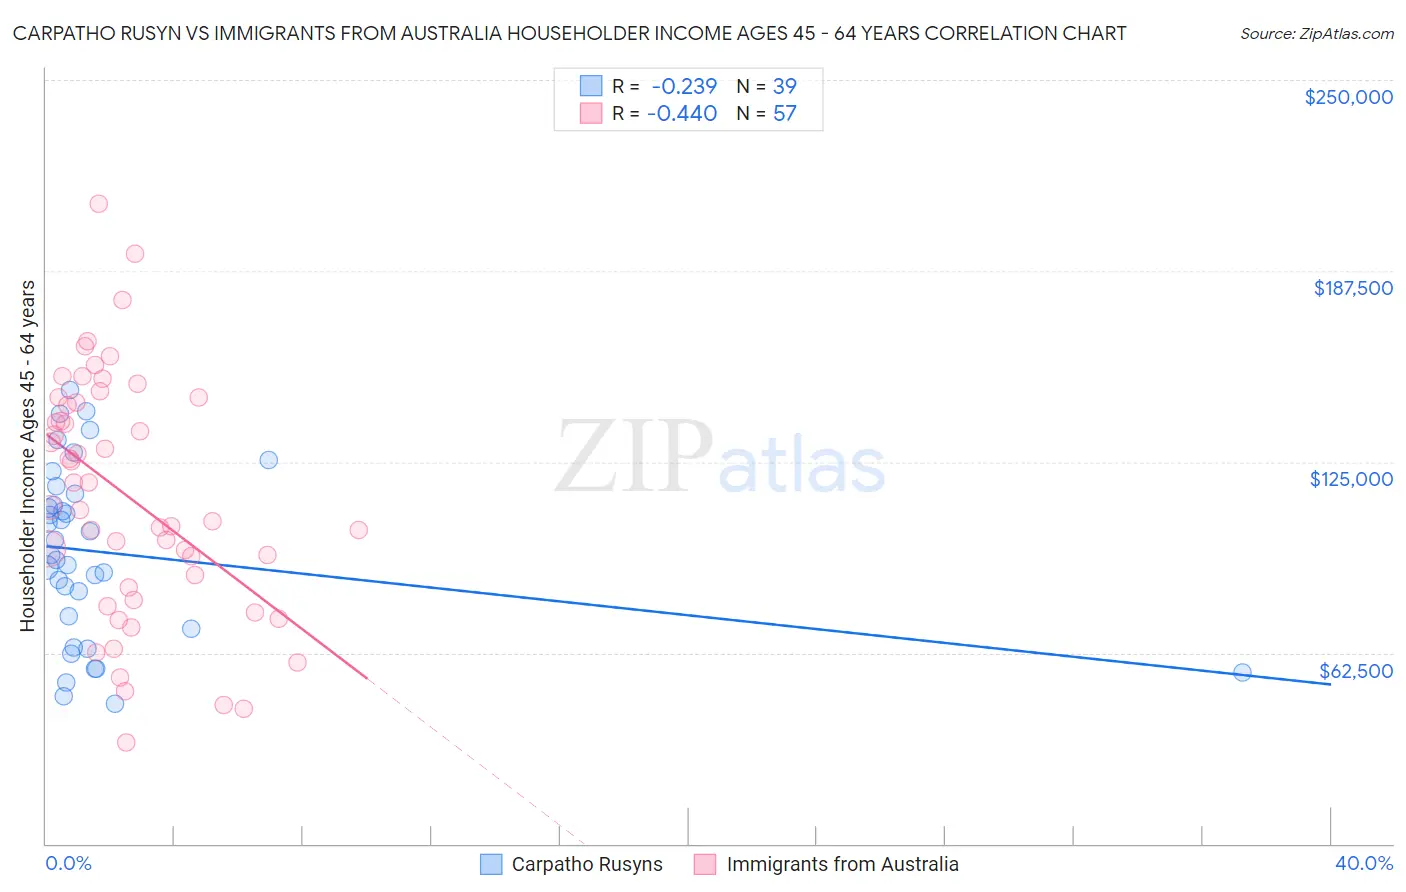
Carpatho Rusyn vs Immigrants from Australia Householder Income Ages 45 - 64 years Correlation Chart
The statistical analysis conducted on geographies consisting of 58,863,567 people shows a weak negative correlation between the proportion of Carpatho Rusyns and household income with householder between the ages 45 and 64 in the United States with a correlation coefficient (R) of -0.239 and weighted average of $102,777. Similarly, the statistical analysis conducted on geographies consisting of 227,010,671 people shows a moderate negative correlation between the proportion of Immigrants from Australia and household income with householder between the ages 45 and 64 in the United States with a correlation coefficient (R) of -0.440 and weighted average of $119,308, a difference of 16.1%.
Householder Income Ages 45 - 64 years Correlation Summary
| Measurement | Carpatho Rusyn | Immigrants from Australia |
| Minimum | $46,000 | $33,125 |
| Maximum | $148,438 | $209,440 |
| Range | $102,438 | $176,315 |
| Mean | $95,246 | $113,549 |
| Median | $94,602 | $110,175 |
| Interquartile 25% (IQ1) | $70,250 | $81,830 |
| Interquartile 75% (IQ3) | $114,408 | $145,190 |
| Interquartile Range (IQR) | $44,158 | $63,360 |
| Standard Deviation (Sample) | $28,203 | $39,602 |
| Standard Deviation (Population) | $27,839 | $39,253 |
Similar Demographics by Householder Income Ages 45 - 64 years
Demographics Similar to Carpatho Rusyns by Householder Income Ages 45 - 64 years
In terms of householder income ages 45 - 64 years, the demographic groups most similar to Carpatho Rusyns are Costa Rican ($102,779, a difference of 0.0%), Immigrants from Ethiopia ($102,763, a difference of 0.010%), Slovene ($102,885, a difference of 0.11%), Slavic ($102,629, a difference of 0.14%), and Scandinavian ($102,969, a difference of 0.19%).
| Demographics | Rating | Rank | Householder Income Ages 45 - 64 years |
| Immigrants | Sierra Leone | 81.1 /100 | #149 | Excellent $103,227 |
| Immigrants | Peru | 80.7 /100 | #150 | Excellent $103,173 |
| Swiss | 79.9 /100 | #151 | Good $103,071 |
| Irish | 79.8 /100 | #152 | Good $103,067 |
| Scandinavians | 79.0 /100 | #153 | Good $102,969 |
| Slovenes | 78.3 /100 | #154 | Good $102,885 |
| Costa Ricans | 77.4 /100 | #155 | Good $102,779 |
| Carpatho Rusyns | 77.4 /100 | #156 | Good $102,777 |
| Immigrants | Ethiopia | 77.3 /100 | #157 | Good $102,763 |
| Slavs | 76.1 /100 | #158 | Good $102,629 |
| Sierra Leoneans | 74.2 /100 | #159 | Good $102,427 |
| Icelanders | 72.5 /100 | #160 | Good $102,261 |
| Immigrants | Nepal | 71.8 /100 | #161 | Good $102,190 |
| Scottish | 71.1 /100 | #162 | Good $102,123 |
| English | 70.1 /100 | #163 | Good $102,021 |
Demographics Similar to Immigrants from Australia by Householder Income Ages 45 - 64 years
In terms of householder income ages 45 - 64 years, the demographic groups most similar to Immigrants from Australia are Immigrants from Sri Lanka ($119,094, a difference of 0.18%), Immigrants from Belgium ($118,932, a difference of 0.32%), Bolivian ($118,871, a difference of 0.37%), Immigrants from Japan ($118,498, a difference of 0.68%), and Asian ($118,426, a difference of 0.74%).
| Demographics | Rating | Rank | Householder Income Ages 45 - 64 years |
| Immigrants | Ireland | 100.0 /100 | #13 | Exceptional $122,757 |
| Indians (Asian) | 100.0 /100 | #14 | Exceptional $122,343 |
| Immigrants | Eastern Asia | 100.0 /100 | #15 | Exceptional $122,222 |
| Immigrants | China | 100.0 /100 | #16 | Exceptional $122,178 |
| Burmese | 100.0 /100 | #17 | Exceptional $121,444 |
| Immigrants | Korea | 100.0 /100 | #18 | Exceptional $121,243 |
| Eastern Europeans | 100.0 /100 | #19 | Exceptional $120,684 |
| Immigrants | Australia | 100.0 /100 | #20 | Exceptional $119,308 |
| Immigrants | Sri Lanka | 100.0 /100 | #21 | Exceptional $119,094 |
| Immigrants | Belgium | 100.0 /100 | #22 | Exceptional $118,932 |
| Bolivians | 100.0 /100 | #23 | Exceptional $118,871 |
| Immigrants | Japan | 100.0 /100 | #24 | Exceptional $118,498 |
| Asians | 100.0 /100 | #25 | Exceptional $118,426 |
| Immigrants | Sweden | 100.0 /100 | #26 | Exceptional $118,318 |
| Immigrants | Northern Europe | 100.0 /100 | #27 | Exceptional $117,930 |