Arab vs Immigrants from Australia Householder Income Ages 45 - 64 years
COMPARE
Arab
Immigrants from Australia
Householder Income Ages 45 - 64 years
Householder Income Ages 45 - 64 years Comparison
Arabs
Immigrants from Australia
$104,566
HOUSEHOLDER INCOME AGES 45 - 64 YEARS
89.3/ 100
METRIC RATING
133rd/ 347
METRIC RANK
$119,308
HOUSEHOLDER INCOME AGES 45 - 64 YEARS
100.0/ 100
METRIC RATING
20th/ 347
METRIC RANK
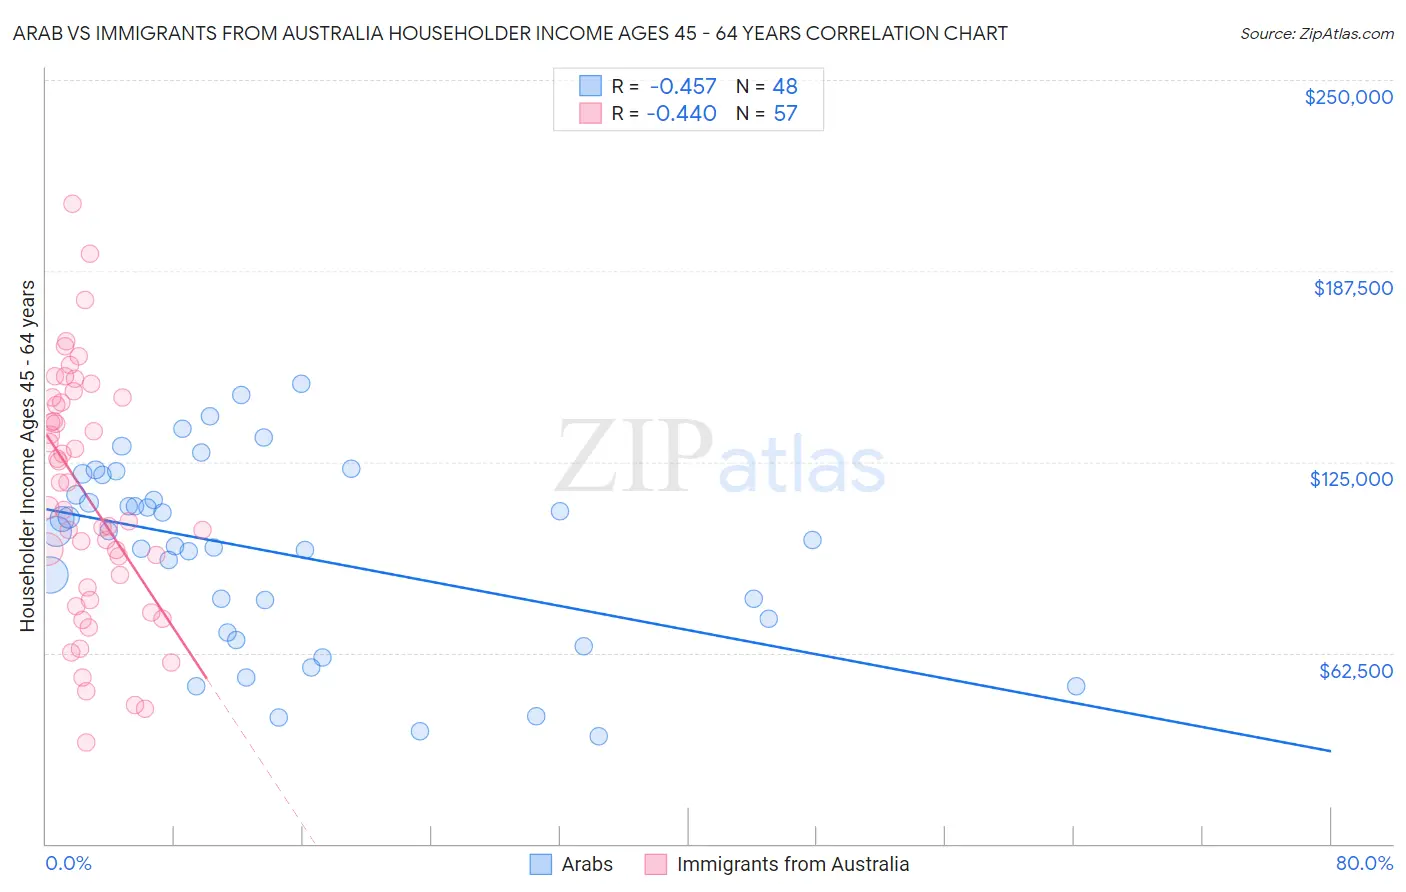
Arab vs Immigrants from Australia Householder Income Ages 45 - 64 years Correlation Chart
The statistical analysis conducted on geographies consisting of 485,614,967 people shows a moderate negative correlation between the proportion of Arabs and household income with householder between the ages 45 and 64 in the United States with a correlation coefficient (R) of -0.457 and weighted average of $104,566. Similarly, the statistical analysis conducted on geographies consisting of 227,010,671 people shows a moderate negative correlation between the proportion of Immigrants from Australia and household income with householder between the ages 45 and 64 in the United States with a correlation coefficient (R) of -0.440 and weighted average of $119,308, a difference of 14.1%.
Householder Income Ages 45 - 64 years Correlation Summary
| Measurement | Arab | Immigrants from Australia |
| Minimum | $35,250 | $33,125 |
| Maximum | $150,539 | $209,440 |
| Range | $115,289 | $176,315 |
| Mean | $95,530 | $113,549 |
| Median | $100,868 | $110,175 |
| Interquartile 25% (IQ1) | $71,485 | $81,830 |
| Interquartile 75% (IQ3) | $117,419 | $145,190 |
| Interquartile Range (IQR) | $45,934 | $63,360 |
| Standard Deviation (Sample) | $30,403 | $39,602 |
| Standard Deviation (Population) | $30,085 | $39,253 |
Similar Demographics by Householder Income Ages 45 - 64 years
Demographics Similar to Arabs by Householder Income Ages 45 - 64 years
In terms of householder income ages 45 - 64 years, the demographic groups most similar to Arabs are Canadian ($104,560, a difference of 0.010%), Brazilian ($104,408, a difference of 0.15%), Lebanese ($104,734, a difference of 0.16%), Immigrants from Syria ($104,858, a difference of 0.28%), and Taiwanese ($104,180, a difference of 0.37%).
| Demographics | Rating | Rank | Householder Income Ages 45 - 64 years |
| Portuguese | 92.4 /100 | #126 | Exceptional $105,309 |
| Immigrants | Saudi Arabia | 92.2 /100 | #127 | Exceptional $105,249 |
| Native Hawaiians | 91.8 /100 | #128 | Exceptional $105,149 |
| Peruvians | 91.5 /100 | #129 | Exceptional $105,070 |
| Immigrants | Zimbabwe | 91.2 /100 | #130 | Exceptional $104,992 |
| Immigrants | Syria | 90.7 /100 | #131 | Exceptional $104,858 |
| Lebanese | 90.1 /100 | #132 | Exceptional $104,734 |
| Arabs | 89.3 /100 | #133 | Excellent $104,566 |
| Canadians | 89.3 /100 | #134 | Excellent $104,560 |
| Brazilians | 88.6 /100 | #135 | Excellent $104,408 |
| Taiwanese | 87.4 /100 | #136 | Excellent $104,180 |
| Hungarians | 85.8 /100 | #137 | Excellent $103,913 |
| Ethiopians | 84.7 /100 | #138 | Excellent $103,736 |
| Immigrants | Oceania | 84.5 /100 | #139 | Excellent $103,705 |
| Norwegians | 84.3 /100 | #140 | Excellent $103,682 |
Demographics Similar to Immigrants from Australia by Householder Income Ages 45 - 64 years
In terms of householder income ages 45 - 64 years, the demographic groups most similar to Immigrants from Australia are Immigrants from Sri Lanka ($119,094, a difference of 0.18%), Immigrants from Belgium ($118,932, a difference of 0.32%), Bolivian ($118,871, a difference of 0.37%), Immigrants from Japan ($118,498, a difference of 0.68%), and Asian ($118,426, a difference of 0.74%).
| Demographics | Rating | Rank | Householder Income Ages 45 - 64 years |
| Immigrants | Ireland | 100.0 /100 | #13 | Exceptional $122,757 |
| Indians (Asian) | 100.0 /100 | #14 | Exceptional $122,343 |
| Immigrants | Eastern Asia | 100.0 /100 | #15 | Exceptional $122,222 |
| Immigrants | China | 100.0 /100 | #16 | Exceptional $122,178 |
| Burmese | 100.0 /100 | #17 | Exceptional $121,444 |
| Immigrants | Korea | 100.0 /100 | #18 | Exceptional $121,243 |
| Eastern Europeans | 100.0 /100 | #19 | Exceptional $120,684 |
| Immigrants | Australia | 100.0 /100 | #20 | Exceptional $119,308 |
| Immigrants | Sri Lanka | 100.0 /100 | #21 | Exceptional $119,094 |
| Immigrants | Belgium | 100.0 /100 | #22 | Exceptional $118,932 |
| Bolivians | 100.0 /100 | #23 | Exceptional $118,871 |
| Immigrants | Japan | 100.0 /100 | #24 | Exceptional $118,498 |
| Asians | 100.0 /100 | #25 | Exceptional $118,426 |
| Immigrants | Sweden | 100.0 /100 | #26 | Exceptional $118,318 |
| Immigrants | Northern Europe | 100.0 /100 | #27 | Exceptional $117,930 |