Carpatho Rusyn vs Immigrants from Argentina Householder Income Ages 45 - 64 years
COMPARE
Carpatho Rusyn
Immigrants from Argentina
Householder Income Ages 45 - 64 years
Householder Income Ages 45 - 64 years Comparison
Carpatho Rusyns
Immigrants from Argentina
$102,777
HOUSEHOLDER INCOME AGES 45 - 64 YEARS
77.4/ 100
METRIC RATING
156th/ 347
METRIC RANK
$108,264
HOUSEHOLDER INCOME AGES 45 - 64 YEARS
98.2/ 100
METRIC RATING
96th/ 347
METRIC RANK
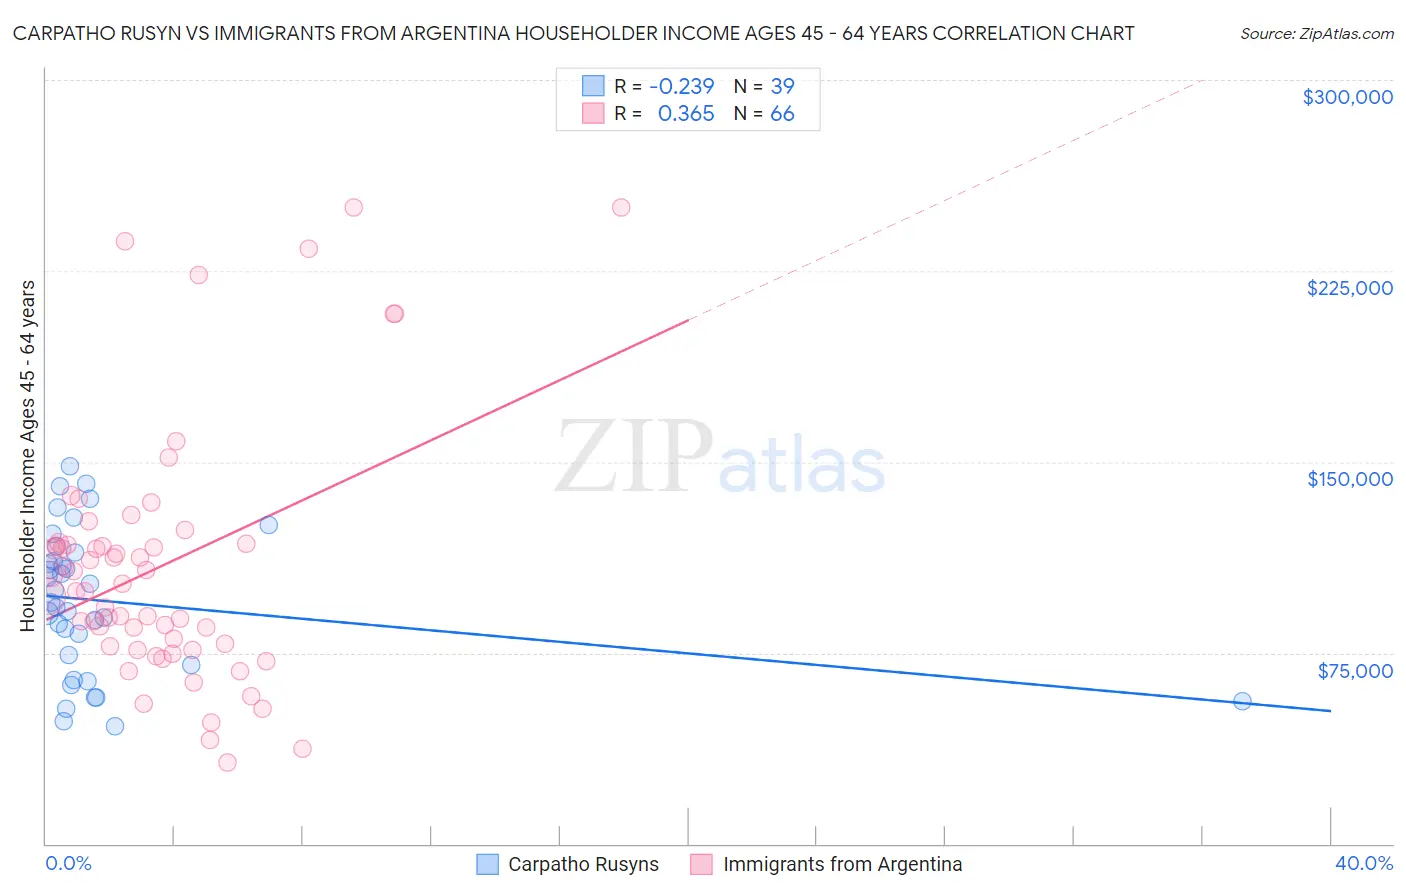
Carpatho Rusyn vs Immigrants from Argentina Householder Income Ages 45 - 64 years Correlation Chart
The statistical analysis conducted on geographies consisting of 58,863,567 people shows a weak negative correlation between the proportion of Carpatho Rusyns and household income with householder between the ages 45 and 64 in the United States with a correlation coefficient (R) of -0.239 and weighted average of $102,777. Similarly, the statistical analysis conducted on geographies consisting of 264,240,865 people shows a mild positive correlation between the proportion of Immigrants from Argentina and household income with householder between the ages 45 and 64 in the United States with a correlation coefficient (R) of 0.365 and weighted average of $108,264, a difference of 5.3%.
Householder Income Ages 45 - 64 years Correlation Summary
| Measurement | Carpatho Rusyn | Immigrants from Argentina |
| Minimum | $46,000 | $31,738 |
| Maximum | $148,438 | $250,001 |
| Range | $102,438 | $218,263 |
| Mean | $95,246 | $109,127 |
| Median | $94,602 | $100,704 |
| Interquartile 25% (IQ1) | $70,250 | $77,665 |
| Interquartile 75% (IQ3) | $114,408 | $117,604 |
| Interquartile Range (IQR) | $44,158 | $39,939 |
| Standard Deviation (Sample) | $28,203 | $49,794 |
| Standard Deviation (Population) | $27,839 | $49,415 |
Similar Demographics by Householder Income Ages 45 - 64 years
Demographics Similar to Carpatho Rusyns by Householder Income Ages 45 - 64 years
In terms of householder income ages 45 - 64 years, the demographic groups most similar to Carpatho Rusyns are Costa Rican ($102,779, a difference of 0.0%), Immigrants from Ethiopia ($102,763, a difference of 0.010%), Slovene ($102,885, a difference of 0.11%), Slavic ($102,629, a difference of 0.14%), and Scandinavian ($102,969, a difference of 0.19%).
| Demographics | Rating | Rank | Householder Income Ages 45 - 64 years |
| Immigrants | Sierra Leone | 81.1 /100 | #149 | Excellent $103,227 |
| Immigrants | Peru | 80.7 /100 | #150 | Excellent $103,173 |
| Swiss | 79.9 /100 | #151 | Good $103,071 |
| Irish | 79.8 /100 | #152 | Good $103,067 |
| Scandinavians | 79.0 /100 | #153 | Good $102,969 |
| Slovenes | 78.3 /100 | #154 | Good $102,885 |
| Costa Ricans | 77.4 /100 | #155 | Good $102,779 |
| Carpatho Rusyns | 77.4 /100 | #156 | Good $102,777 |
| Immigrants | Ethiopia | 77.3 /100 | #157 | Good $102,763 |
| Slavs | 76.1 /100 | #158 | Good $102,629 |
| Sierra Leoneans | 74.2 /100 | #159 | Good $102,427 |
| Icelanders | 72.5 /100 | #160 | Good $102,261 |
| Immigrants | Nepal | 71.8 /100 | #161 | Good $102,190 |
| Scottish | 71.1 /100 | #162 | Good $102,123 |
| English | 70.1 /100 | #163 | Good $102,021 |
Demographics Similar to Immigrants from Argentina by Householder Income Ages 45 - 64 years
In terms of householder income ages 45 - 64 years, the demographic groups most similar to Immigrants from Argentina are Immigrants from Hungary ($108,267, a difference of 0.0%), Sri Lankan ($108,270, a difference of 0.010%), Immigrants from Croatia ($108,304, a difference of 0.040%), Croatian ($108,383, a difference of 0.11%), and Ukrainian ($108,475, a difference of 0.19%).
| Demographics | Rating | Rank | Householder Income Ages 45 - 64 years |
| Ukrainians | 98.3 /100 | #89 | Exceptional $108,475 |
| Immigrants | Philippines | 98.3 /100 | #90 | Exceptional $108,471 |
| Immigrants | Lebanon | 98.3 /100 | #91 | Exceptional $108,471 |
| Croatians | 98.3 /100 | #92 | Exceptional $108,383 |
| Immigrants | Croatia | 98.2 /100 | #93 | Exceptional $108,304 |
| Sri Lankans | 98.2 /100 | #94 | Exceptional $108,270 |
| Immigrants | Hungary | 98.2 /100 | #95 | Exceptional $108,267 |
| Immigrants | Argentina | 98.2 /100 | #96 | Exceptional $108,264 |
| Northern Europeans | 97.8 /100 | #97 | Exceptional $107,870 |
| Immigrants | Southern Europe | 97.7 /100 | #98 | Exceptional $107,775 |
| Palestinians | 97.6 /100 | #99 | Exceptional $107,721 |
| Immigrants | Serbia | 97.4 /100 | #100 | Exceptional $107,569 |
| Immigrants | Kazakhstan | 97.2 /100 | #101 | Exceptional $107,378 |
| Immigrants | Moldova | 97.1 /100 | #102 | Exceptional $107,357 |
| Syrians | 96.9 /100 | #103 | Exceptional $107,207 |