Carpatho Rusyn vs Central American Householder Income Ages 45 - 64 years
COMPARE
Carpatho Rusyn
Central American
Householder Income Ages 45 - 64 years
Householder Income Ages 45 - 64 years Comparison
Carpatho Rusyns
Central Americans
$102,777
HOUSEHOLDER INCOME AGES 45 - 64 YEARS
77.4/ 100
METRIC RATING
156th/ 347
METRIC RANK
$90,951
HOUSEHOLDER INCOME AGES 45 - 64 YEARS
0.9/ 100
METRIC RATING
246th/ 347
METRIC RANK
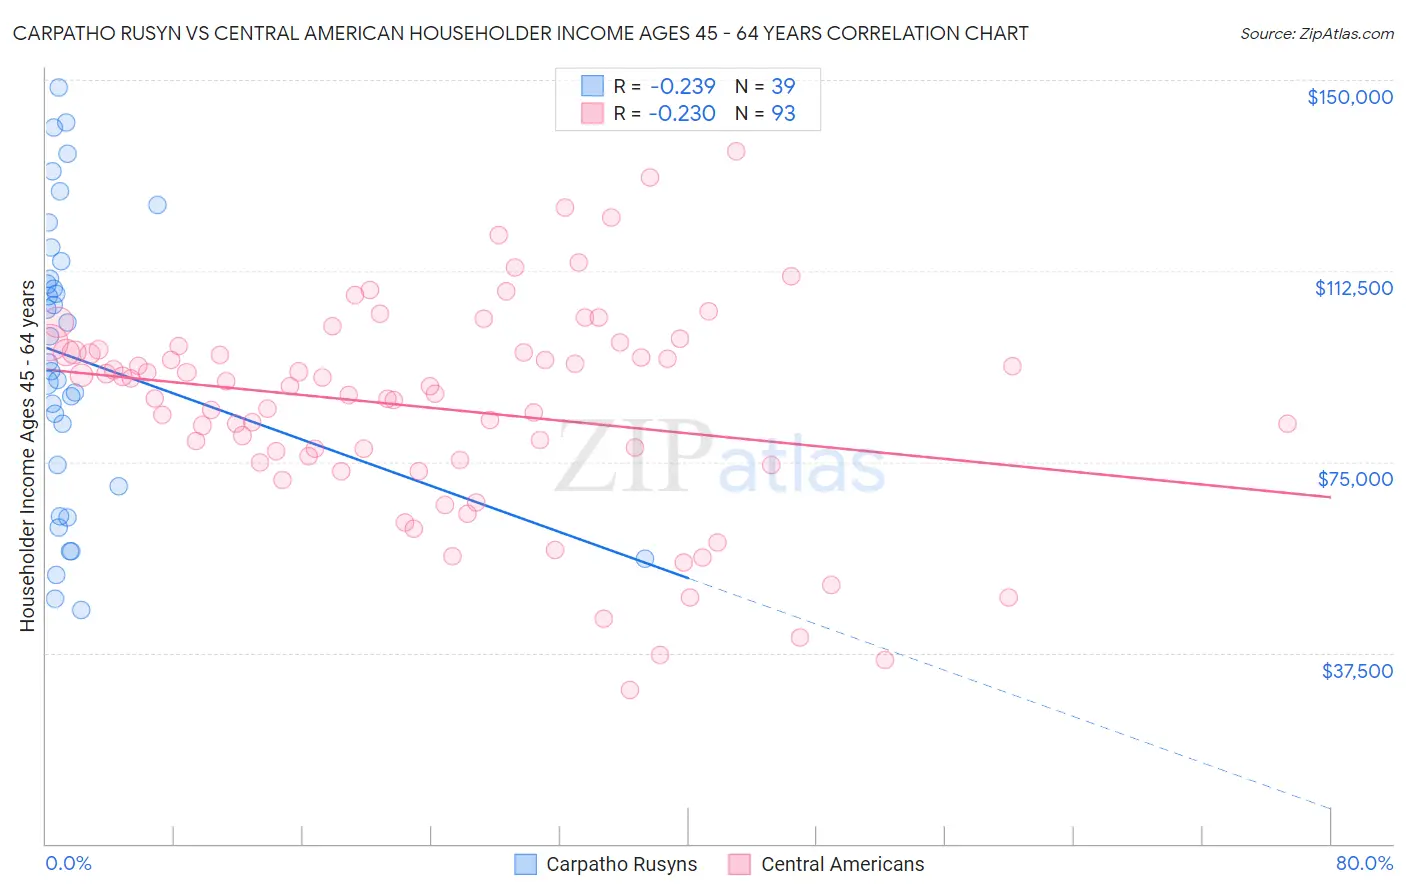
Carpatho Rusyn vs Central American Householder Income Ages 45 - 64 years Correlation Chart
The statistical analysis conducted on geographies consisting of 58,863,567 people shows a weak negative correlation between the proportion of Carpatho Rusyns and household income with householder between the ages 45 and 64 in the United States with a correlation coefficient (R) of -0.239 and weighted average of $102,777. Similarly, the statistical analysis conducted on geographies consisting of 502,874,075 people shows a weak negative correlation between the proportion of Central Americans and household income with householder between the ages 45 and 64 in the United States with a correlation coefficient (R) of -0.230 and weighted average of $90,951, a difference of 13.0%.
Householder Income Ages 45 - 64 years Correlation Summary
| Measurement | Carpatho Rusyn | Central American |
| Minimum | $46,000 | $30,221 |
| Maximum | $148,438 | $135,944 |
| Range | $102,438 | $105,723 |
| Mean | $95,246 | $85,574 |
| Median | $94,602 | $89,913 |
| Interquartile 25% (IQ1) | $70,250 | $75,128 |
| Interquartile 75% (IQ3) | $114,408 | $96,782 |
| Interquartile Range (IQR) | $44,158 | $21,654 |
| Standard Deviation (Sample) | $28,203 | $20,953 |
| Standard Deviation (Population) | $27,839 | $20,840 |
Similar Demographics by Householder Income Ages 45 - 64 years
Demographics Similar to Carpatho Rusyns by Householder Income Ages 45 - 64 years
In terms of householder income ages 45 - 64 years, the demographic groups most similar to Carpatho Rusyns are Costa Rican ($102,779, a difference of 0.0%), Immigrants from Ethiopia ($102,763, a difference of 0.010%), Slovene ($102,885, a difference of 0.11%), Slavic ($102,629, a difference of 0.14%), and Scandinavian ($102,969, a difference of 0.19%).
| Demographics | Rating | Rank | Householder Income Ages 45 - 64 years |
| Immigrants | Sierra Leone | 81.1 /100 | #149 | Excellent $103,227 |
| Immigrants | Peru | 80.7 /100 | #150 | Excellent $103,173 |
| Swiss | 79.9 /100 | #151 | Good $103,071 |
| Irish | 79.8 /100 | #152 | Good $103,067 |
| Scandinavians | 79.0 /100 | #153 | Good $102,969 |
| Slovenes | 78.3 /100 | #154 | Good $102,885 |
| Costa Ricans | 77.4 /100 | #155 | Good $102,779 |
| Carpatho Rusyns | 77.4 /100 | #156 | Good $102,777 |
| Immigrants | Ethiopia | 77.3 /100 | #157 | Good $102,763 |
| Slavs | 76.1 /100 | #158 | Good $102,629 |
| Sierra Leoneans | 74.2 /100 | #159 | Good $102,427 |
| Icelanders | 72.5 /100 | #160 | Good $102,261 |
| Immigrants | Nepal | 71.8 /100 | #161 | Good $102,190 |
| Scottish | 71.1 /100 | #162 | Good $102,123 |
| English | 70.1 /100 | #163 | Good $102,021 |
Demographics Similar to Central Americans by Householder Income Ages 45 - 64 years
In terms of householder income ages 45 - 64 years, the demographic groups most similar to Central Americans are Alaskan Athabascan ($90,951, a difference of 0.0%), Guyanese ($90,966, a difference of 0.020%), Immigrants from Laos ($90,909, a difference of 0.050%), Mexican American Indian ($90,811, a difference of 0.15%), and Subsaharan African ($90,691, a difference of 0.29%).
| Demographics | Rating | Rank | Householder Income Ages 45 - 64 years |
| Immigrants | Ecuador | 1.2 /100 | #239 | Tragic $91,462 |
| Immigrants | Burma/Myanmar | 1.1 /100 | #240 | Tragic $91,385 |
| Trinidadians and Tobagonians | 1.1 /100 | #241 | Tragic $91,357 |
| Inupiat | 1.1 /100 | #242 | Tragic $91,355 |
| Immigrants | Trinidad and Tobago | 1.1 /100 | #243 | Tragic $91,347 |
| Immigrants | Middle Africa | 1.1 /100 | #244 | Tragic $91,293 |
| Guyanese | 0.9 /100 | #245 | Tragic $90,966 |
| Central Americans | 0.9 /100 | #246 | Tragic $90,951 |
| Alaskan Athabascans | 0.9 /100 | #247 | Tragic $90,951 |
| Immigrants | Laos | 0.9 /100 | #248 | Tragic $90,909 |
| Mexican American Indians | 0.8 /100 | #249 | Tragic $90,811 |
| Sub-Saharan Africans | 0.8 /100 | #250 | Tragic $90,691 |
| Americans | 0.7 /100 | #251 | Tragic $90,536 |
| Marshallese | 0.7 /100 | #252 | Tragic $90,455 |
| Barbadians | 0.6 /100 | #253 | Tragic $90,266 |