Carpatho Rusyn vs Immigrants from Australia Per Capita Income
COMPARE
Carpatho Rusyn
Immigrants from Australia
Per Capita Income
Per Capita Income Comparison
Carpatho Rusyns
Immigrants from Australia
$47,248
PER CAPITA INCOME
98.2/ 100
METRIC RATING
97th/ 347
METRIC RANK
$57,953
PER CAPITA INCOME
100.0/ 100
METRIC RATING
4th/ 347
METRIC RANK
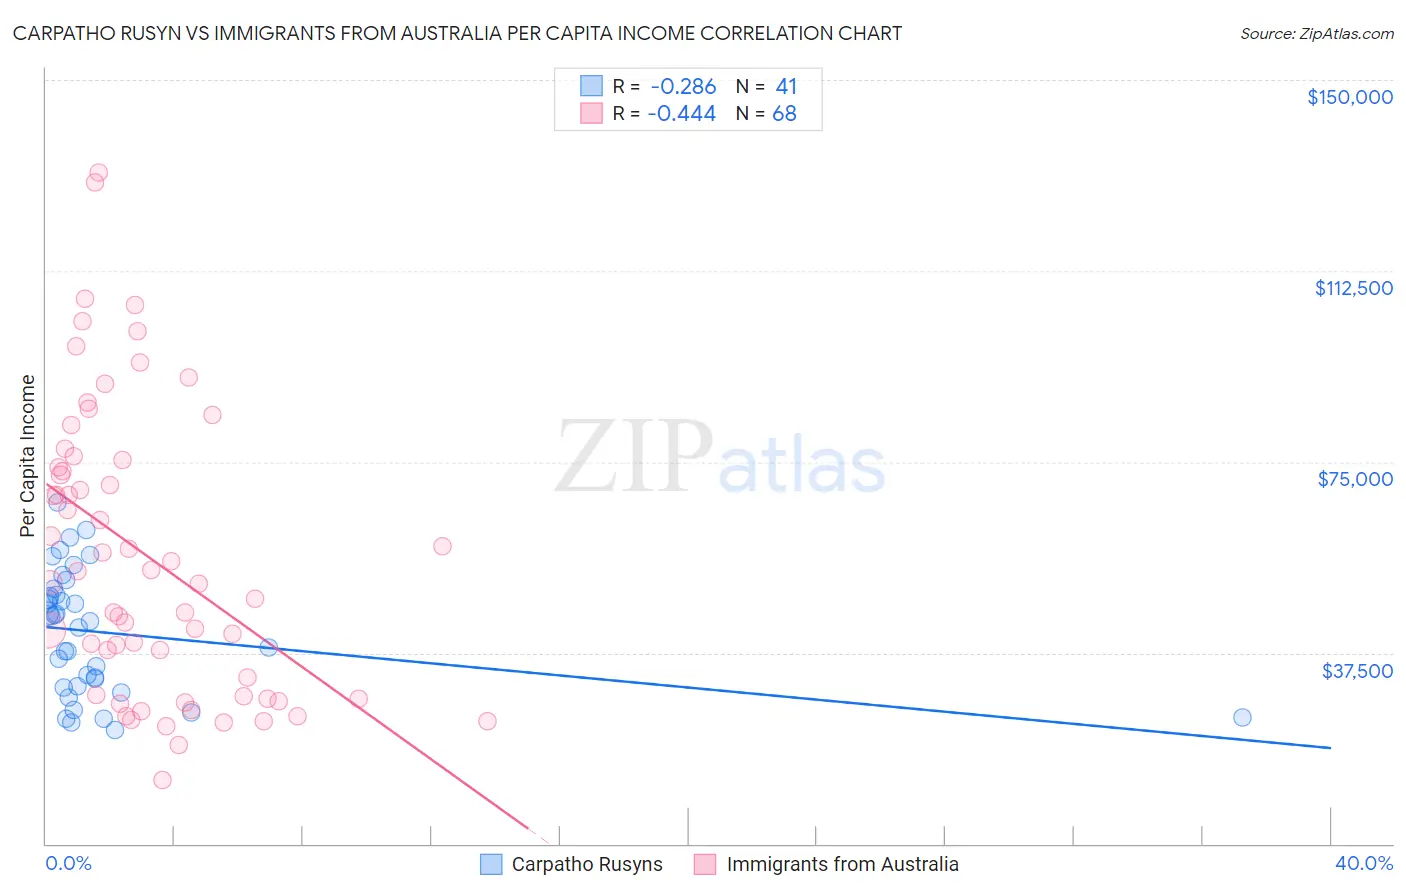
Carpatho Rusyn vs Immigrants from Australia Per Capita Income Correlation Chart
The statistical analysis conducted on geographies consisting of 58,866,831 people shows a weak negative correlation between the proportion of Carpatho Rusyns and per capita income in the United States with a correlation coefficient (R) of -0.286 and weighted average of $47,248. Similarly, the statistical analysis conducted on geographies consisting of 227,208,257 people shows a moderate negative correlation between the proportion of Immigrants from Australia and per capita income in the United States with a correlation coefficient (R) of -0.444 and weighted average of $57,953, a difference of 22.7%.
Per Capita Income Correlation Summary
| Measurement | Carpatho Rusyn | Immigrants from Australia |
| Minimum | $22,343 | $12,597 |
| Maximum | $67,093 | $131,905 |
| Range | $44,750 | $119,308 |
| Mean | $41,437 | $56,529 |
| Median | $43,602 | $52,474 |
| Interquartile 25% (IQ1) | $30,789 | $28,994 |
| Interquartile 75% (IQ3) | $49,474 | $74,709 |
| Interquartile Range (IQR) | $18,684 | $45,716 |
| Standard Deviation (Sample) | $12,046 | $28,217 |
| Standard Deviation (Population) | $11,898 | $28,008 |
Similar Demographics by Per Capita Income
Demographics Similar to Carpatho Rusyns by Per Capita Income
In terms of per capita income, the demographic groups most similar to Carpatho Rusyns are Alsatian ($47,284, a difference of 0.080%), Immigrants from Egypt ($47,361, a difference of 0.24%), Albanian ($47,379, a difference of 0.28%), Immigrants from Zimbabwe ($47,394, a difference of 0.31%), and Immigrants from Pakistan ($47,084, a difference of 0.35%).
| Demographics | Rating | Rank | Per Capita Income |
| Italians | 98.8 /100 | #90 | Exceptional $47,574 |
| Macedonians | 98.8 /100 | #91 | Exceptional $47,573 |
| Immigrants | Moldova | 98.7 /100 | #92 | Exceptional $47,489 |
| Immigrants | Zimbabwe | 98.5 /100 | #93 | Exceptional $47,394 |
| Albanians | 98.5 /100 | #94 | Exceptional $47,379 |
| Immigrants | Egypt | 98.5 /100 | #95 | Exceptional $47,361 |
| Alsatians | 98.3 /100 | #96 | Exceptional $47,284 |
| Carpatho Rusyns | 98.2 /100 | #97 | Exceptional $47,248 |
| Immigrants | Pakistan | 97.9 /100 | #98 | Exceptional $47,084 |
| Laotians | 97.8 /100 | #99 | Exceptional $47,041 |
| Immigrants | Lebanon | 97.5 /100 | #100 | Exceptional $46,938 |
| Immigrants | Uzbekistan | 97.5 /100 | #101 | Exceptional $46,929 |
| Immigrants | Western Asia | 97.4 /100 | #102 | Exceptional $46,876 |
| Syrians | 97.2 /100 | #103 | Exceptional $46,837 |
| Brazilians | 96.8 /100 | #104 | Exceptional $46,700 |
Demographics Similar to Immigrants from Australia by Per Capita Income
In terms of per capita income, the demographic groups most similar to Immigrants from Australia are Immigrants from Iran ($57,759, a difference of 0.34%), Immigrants from Taiwan ($57,742, a difference of 0.37%), Immigrants from Singapore ($58,353, a difference of 0.69%), Immigrants from Israel ($57,384, a difference of 0.99%), and Iranian ($58,786, a difference of 1.4%).
| Demographics | Rating | Rank | Per Capita Income |
| Filipinos | 100.0 /100 | #1 | Exceptional $59,066 |
| Iranians | 100.0 /100 | #2 | Exceptional $58,786 |
| Immigrants | Singapore | 100.0 /100 | #3 | Exceptional $58,353 |
| Immigrants | Australia | 100.0 /100 | #4 | Exceptional $57,953 |
| Immigrants | Iran | 100.0 /100 | #5 | Exceptional $57,759 |
| Immigrants | Taiwan | 100.0 /100 | #6 | Exceptional $57,742 |
| Immigrants | Israel | 100.0 /100 | #7 | Exceptional $57,384 |
| Immigrants | Hong Kong | 100.0 /100 | #8 | Exceptional $56,709 |
| Immigrants | Ireland | 100.0 /100 | #9 | Exceptional $56,584 |
| Okinawans | 100.0 /100 | #10 | Exceptional $55,817 |
| Eastern Europeans | 100.0 /100 | #11 | Exceptional $55,780 |
| Immigrants | Sweden | 100.0 /100 | #12 | Exceptional $55,582 |
| Immigrants | India | 100.0 /100 | #13 | Exceptional $55,268 |
| Immigrants | Belgium | 100.0 /100 | #14 | Exceptional $55,082 |
| Cypriots | 100.0 /100 | #15 | Exceptional $54,899 |