Carpatho Rusyn vs Immigrants from Western Europe Householder Income Ages 45 - 64 years
COMPARE
Carpatho Rusyn
Immigrants from Western Europe
Householder Income Ages 45 - 64 years
Householder Income Ages 45 - 64 years Comparison
Carpatho Rusyns
Immigrants from Western Europe
$102,777
HOUSEHOLDER INCOME AGES 45 - 64 YEARS
77.4/ 100
METRIC RATING
156th/ 347
METRIC RANK
$108,824
HOUSEHOLDER INCOME AGES 45 - 64 YEARS
98.6/ 100
METRIC RATING
84th/ 347
METRIC RANK
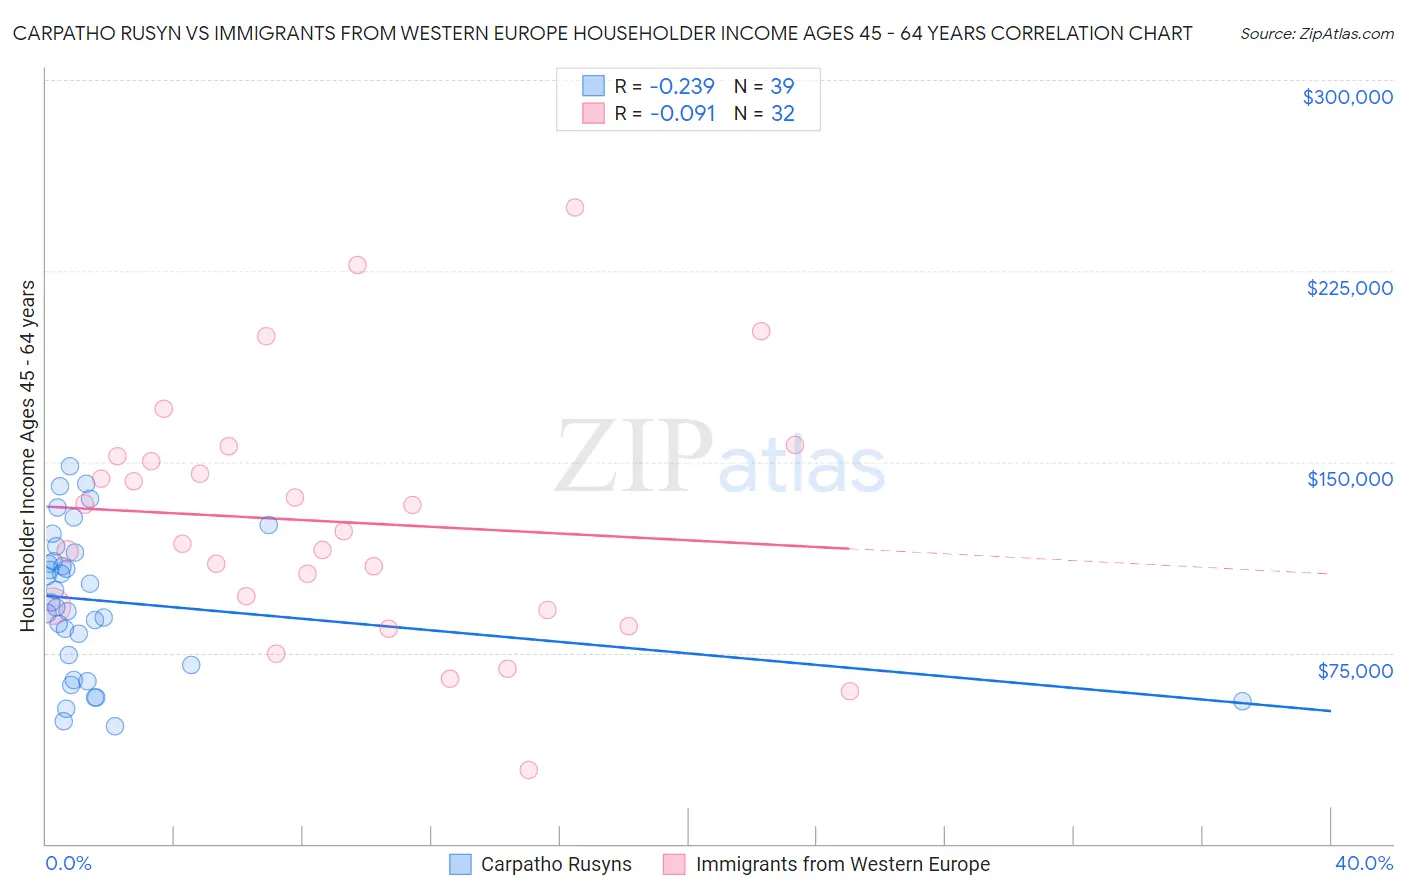
Carpatho Rusyn vs Immigrants from Western Europe Householder Income Ages 45 - 64 years Correlation Chart
The statistical analysis conducted on geographies consisting of 58,863,567 people shows a weak negative correlation between the proportion of Carpatho Rusyns and household income with householder between the ages 45 and 64 in the United States with a correlation coefficient (R) of -0.239 and weighted average of $102,777. Similarly, the statistical analysis conducted on geographies consisting of 492,840,606 people shows a slight negative correlation between the proportion of Immigrants from Western Europe and household income with householder between the ages 45 and 64 in the United States with a correlation coefficient (R) of -0.091 and weighted average of $108,824, a difference of 5.9%.
Householder Income Ages 45 - 64 years Correlation Summary
| Measurement | Carpatho Rusyn | Immigrants from Western Europe |
| Minimum | $46,000 | $28,859 |
| Maximum | $148,438 | $250,001 |
| Range | $102,438 | $221,142 |
| Mean | $95,246 | $126,348 |
| Median | $94,602 | $120,399 |
| Interquartile 25% (IQ1) | $70,250 | $92,693 |
| Interquartile 75% (IQ3) | $114,408 | $151,414 |
| Interquartile Range (IQR) | $44,158 | $58,721 |
| Standard Deviation (Sample) | $28,203 | $48,876 |
| Standard Deviation (Population) | $27,839 | $48,106 |
Similar Demographics by Householder Income Ages 45 - 64 years
Demographics Similar to Carpatho Rusyns by Householder Income Ages 45 - 64 years
In terms of householder income ages 45 - 64 years, the demographic groups most similar to Carpatho Rusyns are Costa Rican ($102,779, a difference of 0.0%), Immigrants from Ethiopia ($102,763, a difference of 0.010%), Slovene ($102,885, a difference of 0.11%), Slavic ($102,629, a difference of 0.14%), and Scandinavian ($102,969, a difference of 0.19%).
| Demographics | Rating | Rank | Householder Income Ages 45 - 64 years |
| Immigrants | Sierra Leone | 81.1 /100 | #149 | Excellent $103,227 |
| Immigrants | Peru | 80.7 /100 | #150 | Excellent $103,173 |
| Swiss | 79.9 /100 | #151 | Good $103,071 |
| Irish | 79.8 /100 | #152 | Good $103,067 |
| Scandinavians | 79.0 /100 | #153 | Good $102,969 |
| Slovenes | 78.3 /100 | #154 | Good $102,885 |
| Costa Ricans | 77.4 /100 | #155 | Good $102,779 |
| Carpatho Rusyns | 77.4 /100 | #156 | Good $102,777 |
| Immigrants | Ethiopia | 77.3 /100 | #157 | Good $102,763 |
| Slavs | 76.1 /100 | #158 | Good $102,629 |
| Sierra Leoneans | 74.2 /100 | #159 | Good $102,427 |
| Icelanders | 72.5 /100 | #160 | Good $102,261 |
| Immigrants | Nepal | 71.8 /100 | #161 | Good $102,190 |
| Scottish | 71.1 /100 | #162 | Good $102,123 |
| English | 70.1 /100 | #163 | Good $102,021 |
Demographics Similar to Immigrants from Western Europe by Householder Income Ages 45 - 64 years
In terms of householder income ages 45 - 64 years, the demographic groups most similar to Immigrants from Western Europe are Immigrants from Afghanistan ($108,785, a difference of 0.040%), Austrian ($108,692, a difference of 0.12%), Tongan ($108,643, a difference of 0.17%), Romanian ($108,609, a difference of 0.20%), and Immigrants from Spain ($109,051, a difference of 0.21%).
| Demographics | Rating | Rank | Householder Income Ages 45 - 64 years |
| Immigrants | England | 99.0 /100 | #77 | Exceptional $109,446 |
| Immigrants | Canada | 99.0 /100 | #78 | Exceptional $109,402 |
| Immigrants | Bulgaria | 98.9 /100 | #79 | Exceptional $109,379 |
| Jordanians | 98.9 /100 | #80 | Exceptional $109,376 |
| Immigrants | Eastern Europe | 98.9 /100 | #81 | Exceptional $109,335 |
| Immigrants | North America | 98.8 /100 | #82 | Exceptional $109,198 |
| Immigrants | Spain | 98.8 /100 | #83 | Exceptional $109,051 |
| Immigrants | Western Europe | 98.6 /100 | #84 | Exceptional $108,824 |
| Immigrants | Afghanistan | 98.6 /100 | #85 | Exceptional $108,785 |
| Austrians | 98.5 /100 | #86 | Exceptional $108,692 |
| Tongans | 98.5 /100 | #87 | Exceptional $108,643 |
| Romanians | 98.5 /100 | #88 | Exceptional $108,609 |
| Ukrainians | 98.3 /100 | #89 | Exceptional $108,475 |
| Immigrants | Philippines | 98.3 /100 | #90 | Exceptional $108,471 |
| Immigrants | Lebanon | 98.3 /100 | #91 | Exceptional $108,471 |