Immigrants from Nigeria vs Immigrants from Australia Householder Income Ages 45 - 64 years

COMPARE

Immigrants from Nigeria
Race
Ancestry
AfghanAfricanAlaska NativeAlaskan AthabascanAlbanianAleutAlsatianAmericanApacheArabArapahoArgentineanArmenianAssyrian/Chaldean/SyriacAustralianAustrianBahamianBangladeshiBarbadianBasqueBelgianBelizeanBermudanBhutaneseBlackfeetBolivianBrazilianBritishBritish West IndianBulgarianBurmeseCajunCambodianCanadianCape VerdeanCarpatho RusynCelticCentral AmericanCentral American IndianCherokeeCheyenneChickasawChileanChineseChippewaChoctawColombianColvilleComancheCosta RicanCreeCreekCroatianCrowCubanCypriotCzechCzechoslovakianDanishDelawareDominicanDutchDutch West IndianEastern EuropeanEcuadorianEgyptianEnglishEstonianEthiopianEuropeanFijianFilipinoFinnishFrenchFrench American IndianFrench CanadianGermanGerman RussianGhanaianGreekGuamanian/ChamorroGuatemalanGuyaneseHaitianHmongHonduranHopiHoumaHungarianIcelanderIndian (Asian)IndonesianInupiatIranianIraqiIrishIroquoisIsraeliItalianJamaicanJapaneseJordanianKenyanKiowaKoreanLaotianLatvianLebaneseLiberianLithuanianLumbeeLuxembourgerMacedonianMalaysianMalteseMarshalleseMenomineeMexicanMexican American IndianMongolianMoroccanNative HawaiianNavajoNepaleseNew ZealanderNicaraguanNigerianNorthern EuropeanNorwegianOkinawanOsageOttawaPaiutePakistaniPalestinianPanamanianParaguayanPennsylvania GermanPeruvianPimaPolishPortuguesePotawatomiPuebloPuerto RicanPuget Sound SalishRomanianRussianSalvadoranSamoanScandinavianScotch-IrishScottishSeminoleSenegaleseSerbianShoshoneSierra LeoneanSiouxSlavicSlovakSloveneSomaliSouth AfricanSouth AmericanSouth American IndianSoviet UnionSpaniardSpanishSpanish AmericanSpanish American IndianSri LankanSubsaharan AfricanSudaneseSwedishSwissSyrianTaiwaneseThaiTlingit-HaidaTohono O'OdhamTonganTrinidadian and TobagonianTsimshianTurkishU.S. Virgin IslanderUgandanUkrainianUruguayanUteVenezuelanVietnameseWelshWest IndianYakamaYaquiYugoslavianYumanYup'ikZimbabwean
Immigration
NonimmigrantsImmigrantsAfghanistanAfricaAlbaniaArgentinaArmeniaAsiaAustriaBahamasBangladeshBarbadosBelarusBelgiumBelizeBoliviaBosnia and HerzegovinaBrazilBulgariaBurma/MyanmarCabo VerdeCambodiaCameroonCanadaCaribbeanCentral AmericaChileChinaColombiaCongoCosta RicaCroatiaCubaCzechoslovakiaDenmarkDominicaDominican RepublicEastern AfricaEastern AsiaEastern EuropeEcuadorEgyptEl SalvadorEnglandEritreaEthiopiaEuropeFijiFranceGermanyGhanaGreeceGrenadaGuatemalaGuyanaHaitiHondurasHong KongHungaryIndiaIndonesiaIranIraqIrelandIsraelItalyJamaicaJapanJordanKazakhstanKenyaKoreaKuwaitLaosLatin AmericaLatviaLebanonLiberiaLithuaniaMalaysiaMexicoMicronesiaMiddle AfricaMoldovaMoroccoNepalNetherlandsNicaraguaNigeriaNorth AmericaNorth MacedoniaNorthern AfricaNorthern EuropeNorwayOceaniaPakistanPanamaPeruPhilippinesPolandPortugalRomaniaRussiaSaudi ArabiaScotlandSenegalSerbiaSierra LeoneSingaporeSomaliaSouth AfricaSouth AmericaSouth Central AsiaSouth Eastern AsiaSouthern EuropeSpainSri LankaSt. Vincent and the GrenadinesSudanSwedenSwitzerlandSyriaTaiwanThailandTrinidad and TobagoTurkeyUgandaUkraineUruguayUzbekistanVenezuelaVietnamWest IndiesWestern AfricaWestern AsiaWestern EuropeYemenZaireZimbabweAzores
Immigrants from Australia
Race
Ancestry
AfghanAfricanAlaska NativeAlaskan AthabascanAlbanianAleutAlsatianAmericanApacheArabArapahoArgentineanArmenianAssyrian/Chaldean/SyriacAustralianAustrianBahamianBangladeshiBarbadianBasqueBelgianBelizeanBermudanBhutaneseBlackfeetBolivianBrazilianBritishBritish West IndianBulgarianBurmeseCajunCambodianCanadianCape VerdeanCarpatho RusynCelticCentral AmericanCentral American IndianCherokeeCheyenneChickasawChileanChineseChippewaChoctawColombianColvilleComancheCosta RicanCreeCreekCroatianCrowCubanCypriotCzechCzechoslovakianDanishDelawareDominicanDutchDutch West IndianEastern EuropeanEcuadorianEgyptianEnglishEstonianEthiopianEuropeanFijianFilipinoFinnishFrenchFrench American IndianFrench CanadianGermanGerman RussianGhanaianGreekGuamanian/ChamorroGuatemalanGuyaneseHaitianHmongHonduranHopiHoumaHungarianIcelanderIndian (Asian)IndonesianInupiatIranianIraqiIrishIroquoisIsraeliItalianJamaicanJapaneseJordanianKenyanKiowaKoreanLaotianLatvianLebaneseLiberianLithuanianLumbeeLuxembourgerMacedonianMalaysianMalteseMarshalleseMenomineeMexicanMexican American IndianMongolianMoroccanNative HawaiianNavajoNepaleseNew ZealanderNicaraguanNigerianNorthern EuropeanNorwegianOkinawanOsageOttawaPaiutePakistaniPalestinianPanamanianParaguayanPennsylvania GermanPeruvianPimaPolishPortuguesePotawatomiPuebloPuerto RicanPuget Sound SalishRomanianRussianSalvadoranSamoanScandinavianScotch-IrishScottishSeminoleSenegaleseSerbianShoshoneSierra LeoneanSiouxSlavicSlovakSloveneSomaliSouth AfricanSouth AmericanSouth American IndianSoviet UnionSpaniardSpanishSpanish AmericanSpanish American IndianSri LankanSubsaharan AfricanSudaneseSwedishSwissSyrianTaiwaneseThaiTlingit-HaidaTohono O'OdhamTonganTrinidadian and TobagonianTsimshianTurkishU.S. Virgin IslanderUgandanUkrainianUruguayanUteVenezuelanVietnameseWelshWest IndianYakamaYaquiYugoslavianYumanYup'ikZimbabwean
Immigration
NonimmigrantsImmigrantsAfghanistanAfricaAlbaniaArgentinaArmeniaAsiaAustraliaAustriaBahamasBangladeshBarbadosBelarusBelgiumBelizeBoliviaBosnia and HerzegovinaBrazilBulgariaBurma/MyanmarCabo VerdeCambodiaCameroonCanadaCaribbeanCentral AmericaChileChinaColombiaCongoCosta RicaCroatiaCubaCzechoslovakiaDenmarkDominicaDominican RepublicEastern AfricaEastern AsiaEastern EuropeEcuadorEgyptEl SalvadorEnglandEritreaEthiopiaEuropeFijiFranceGermanyGhanaGreeceGrenadaGuatemalaGuyanaHaitiHondurasHong KongHungaryIndiaIndonesiaIranIraqIrelandIsraelItalyJamaicaJapanJordanKazakhstanKenyaKoreaKuwaitLaosLatin AmericaLatviaLebanonLiberiaLithuaniaMalaysiaMexicoMicronesiaMiddle AfricaMoldovaMoroccoNepalNetherlandsNicaraguaNorth AmericaNorth MacedoniaNorthern AfricaNorthern EuropeNorwayOceaniaPakistanPanamaPeruPhilippinesPolandPortugalRomaniaRussiaSaudi ArabiaScotlandSenegalSerbiaSierra LeoneSingaporeSomaliaSouth AfricaSouth AmericaSouth Central AsiaSouth Eastern AsiaSouthern EuropeSpainSri LankaSt. Vincent and the GrenadinesSudanSwedenSwitzerlandSyriaTaiwanThailandTrinidad and TobagoTurkeyUgandaUkraineUruguayUzbekistanVenezuelaVietnamWest IndiesWestern AfricaWestern AsiaWestern EuropeYemenZaireZimbabweAzores
Householder Income Ages 45 - 64 years
Income
Poverty
Unemployment
Labor Participation
Family Structure
Vehicle Availability
Education Level
Disability

Householder Income Ages 45 - 64 years Comparison

Immigrants from Nigeria

Immigrants from Australia

Tragic
Exceptional
$94,804
HOUSEHOLDER INCOME AGES 45 - 64 YEARS
5.9/ 100
METRIC RATING
221st/ 347
METRIC RANK
$119,308
HOUSEHOLDER INCOME AGES 45 - 64 YEARS
100.0/ 100
METRIC RATING
20th/ 347
METRIC RANK

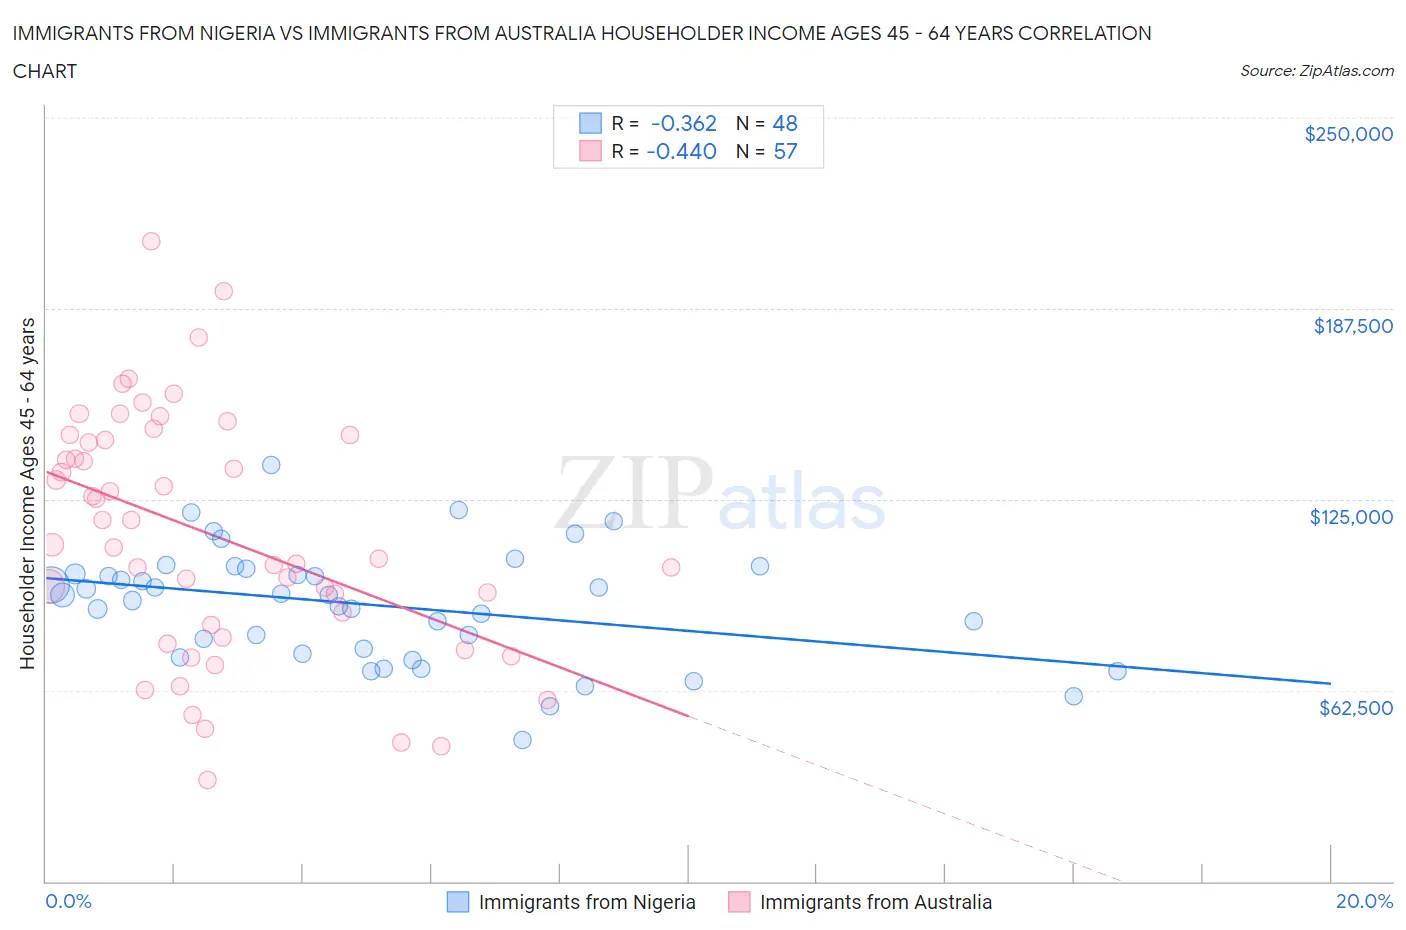
Immigrants from Nigeria vs Immigrants from Australia Householder Income Ages 45 - 64 years Correlation Chart

The statistical analysis conducted on geographies consisting of 283,069,423 people shows a mild negative correlation between the proportion of Immigrants from Nigeria and household income with householder between the ages 45 and 64 in the United States with a correlation coefficient (R) of -0.362 and weighted average of $94,804. Similarly, the statistical analysis conducted on geographies consisting of 227,010,671 people shows a moderate negative correlation between the proportion of Immigrants from Australia and household income with householder between the ages 45 and 64 in the United States with a correlation coefficient (R) of -0.440 and weighted average of $119,308, a difference of 25.9%.
Immigrants from Nigeria vs Immigrants from Australia Householder Income Ages 45 - 64 years

Householder Income Ages 45 - 64 years Correlation Summary

MeasurementImmigrants from NigeriaImmigrants from Australia
Minimum$46,429$33,125
Maximum$136,191$209,440
Range$89,762$176,315
Mean$90,499$113,549
Median$93,669$110,175
Interquartile 25% (IQ1)$75,303$81,830
Interquartile 75% (IQ3)$101,492$145,190
Interquartile Range (IQR)$26,189$63,360
Standard Deviation (Sample)$18,699$39,602
Standard Deviation (Population)$18,504$39,253

Similar Demographics by Householder Income Ages 45 - 64 years

Demographics Similar to Immigrants from Nigeria by Householder Income Ages 45 - 64 years

In terms of householder income ages 45 - 64 years, the demographic groups most similar to Immigrants from Nigeria are Salvadoran ($94,842, a difference of 0.040%), Immigrants from Armenia ($94,863, a difference of 0.060%), Delaware ($94,914, a difference of 0.12%), Immigrants from Ghana ($94,982, a difference of 0.19%), and Malaysian ($94,517, a difference of 0.30%).
DemographicsRating | RankHouseholder Income Ages 45 - 64 years
Panamanians
10.6
/100
|
#214
Poor
$96,066
Nigerians
8.2
/100
|
#215
Tragic
$95,492
Immigrants | Venezuela
7.6
/100
|
#216
Tragic
$95,342
Immigrants | Ghana
6.4
/100
|
#217
Tragic
$94,982
Delaware
6.2
/100
|
#218
Tragic
$94,914
Immigrants | Armenia
6.1
/100
|
#219
Tragic
$94,863
Salvadorans
6.0
/100
|
#220
Tragic
$94,842
Immigrants | Nigeria
5.9
/100
|
#221
Tragic
$94,804
Malaysians
5.2
/100
|
#222
Tragic
$94,517
Immigrants | Nonimmigrants
5.0
/100
|
#223
Tragic
$94,448
Immigrants | Bosnia and Herzegovina
4.6
/100
|
#224
Tragic
$94,288
Bermudans
4.4
/100
|
#225
Tragic
$94,197
Immigrants | Azores
4.3
/100
|
#226
Tragic
$94,138
Alaska Natives
4.0
/100
|
#227
Tragic
$93,991
Immigrants | Panama
3.7
/100
|
#228
Tragic
$93,815

Demographics Similar to Immigrants from Australia by Householder Income Ages 45 - 64 years

In terms of householder income ages 45 - 64 years, the demographic groups most similar to Immigrants from Australia are Immigrants from Sri Lanka ($119,094, a difference of 0.18%), Immigrants from Belgium ($118,932, a difference of 0.32%), Bolivian ($118,871, a difference of 0.37%), Immigrants from Japan ($118,498, a difference of 0.68%), and Asian ($118,426, a difference of 0.74%).
DemographicsRating | RankHouseholder Income Ages 45 - 64 years
Immigrants | Ireland
100.0
/100
|
#13
Exceptional
$122,757
Indians (Asian)
100.0
/100
|
#14
Exceptional
$122,343
Immigrants | Eastern Asia
100.0
/100
|
#15
Exceptional
$122,222
Immigrants | China
100.0
/100
|
#16
Exceptional
$122,178
Burmese
100.0
/100
|
#17
Exceptional
$121,444
Immigrants | Korea
100.0
/100
|
#18
Exceptional
$121,243
Eastern Europeans
100.0
/100
|
#19
Exceptional
$120,684
Immigrants | Australia
100.0
/100
|
#20
Exceptional
$119,308
Immigrants | Sri Lanka
100.0
/100
|
#21
Exceptional
$119,094
Immigrants | Belgium
100.0
/100
|
#22
Exceptional
$118,932
Bolivians
100.0
/100
|
#23
Exceptional
$118,871
Immigrants | Japan
100.0
/100
|
#24
Exceptional
$118,498
Asians
100.0
/100
|
#25
Exceptional
$118,426
Immigrants | Sweden
100.0
/100
|
#26
Exceptional
$118,318
Immigrants | Northern Europe
100.0
/100
|
#27
Exceptional
$117,930