Carpatho Rusyn vs Immigrants from Australia Child Poverty Under the Age of 5
COMPARE
Carpatho Rusyn
Immigrants from Australia
Child Poverty Under the Age of 5
Child Poverty Under the Age of 5 Comparison
Carpatho Rusyns
Immigrants from Australia
17.5%
CHILD POVERTY UNDER THE AGE OF 5
33.6/ 100
METRIC RATING
188th/ 347
METRIC RANK
14.6%
CHILD POVERTY UNDER THE AGE OF 5
99.7/ 100
METRIC RATING
40th/ 347
METRIC RANK
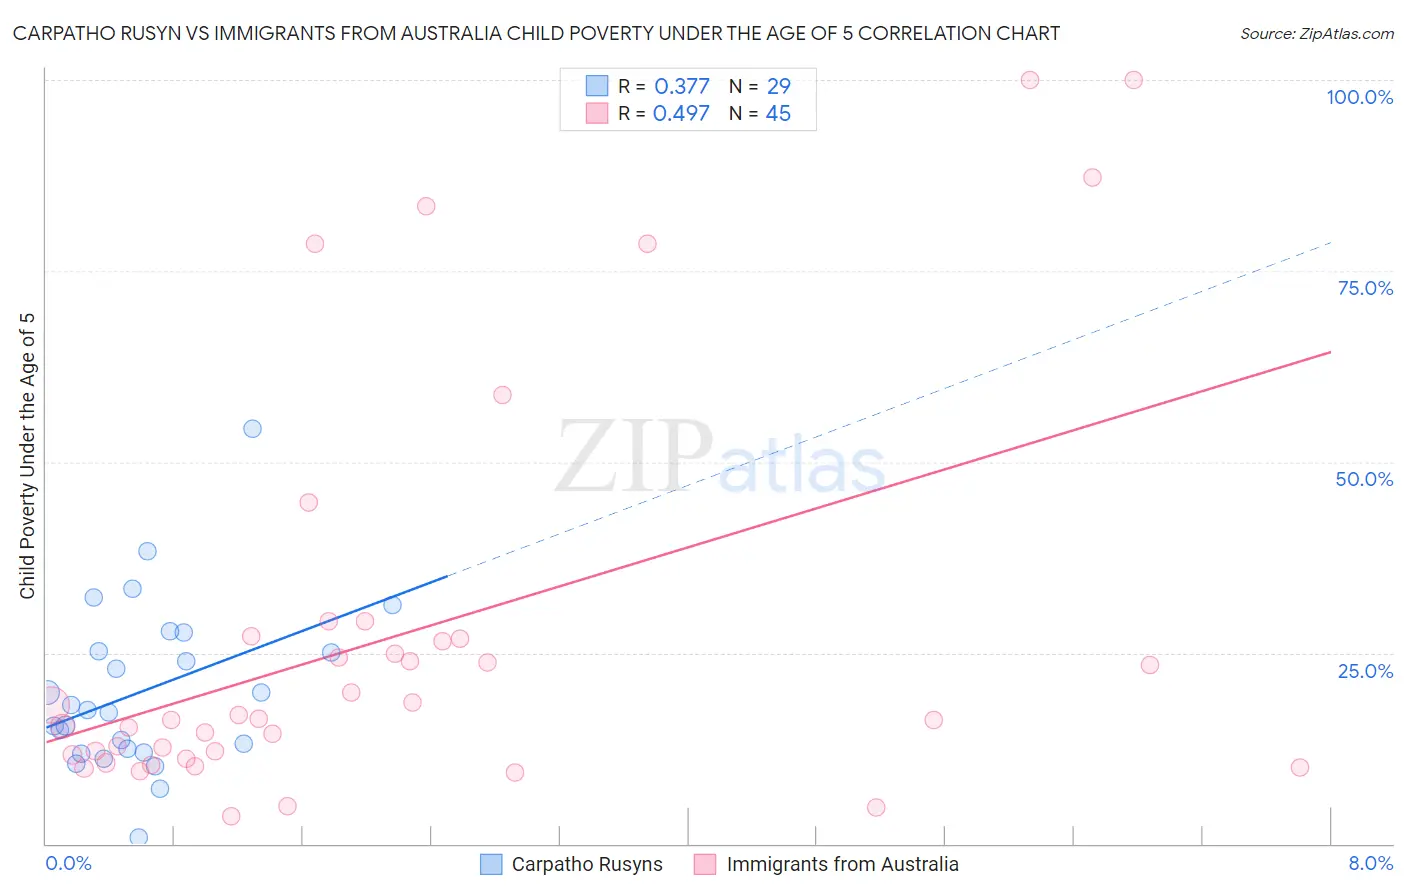
Carpatho Rusyn vs Immigrants from Australia Child Poverty Under the Age of 5 Correlation Chart
The statistical analysis conducted on geographies consisting of 57,729,795 people shows a mild positive correlation between the proportion of Carpatho Rusyns and poverty level among children under the age of 5 in the United States with a correlation coefficient (R) of 0.377 and weighted average of 17.5%. Similarly, the statistical analysis conducted on geographies consisting of 218,715,410 people shows a moderate positive correlation between the proportion of Immigrants from Australia and poverty level among children under the age of 5 in the United States with a correlation coefficient (R) of 0.497 and weighted average of 14.6%, a difference of 19.8%.
Child Poverty Under the Age of 5 Correlation Summary
| Measurement | Carpatho Rusyn | Immigrants from Australia |
| Minimum | 0.75% | 3.6% |
| Maximum | 54.4% | 100.0% |
| Range | 53.6% | 96.4% |
| Mean | 20.1% | 27.3% |
| Median | 17.6% | 16.3% |
| Interquartile 25% (IQ1) | 12.2% | 11.4% |
| Interquartile 75% (IQ3) | 26.4% | 27.0% |
| Interquartile Range (IQR) | 14.1% | 15.6% |
| Standard Deviation (Sample) | 10.9% | 26.2% |
| Standard Deviation (Population) | 10.7% | 25.9% |
Similar Demographics by Child Poverty Under the Age of 5
Demographics Similar to Carpatho Rusyns by Child Poverty Under the Age of 5
In terms of child poverty under the age of 5, the demographic groups most similar to Carpatho Rusyns are French (17.5%, a difference of 0.010%), Kenyan (17.5%, a difference of 0.12%), Immigrants from Bosnia and Herzegovina (17.5%, a difference of 0.16%), Immigrants from Armenia (17.5%, a difference of 0.49%), and Slovak (17.6%, a difference of 0.53%).
| Demographics | Rating | Rank | Child Poverty Under the Age of 5 |
| Immigrants | Germany | 41.0 /100 | #181 | Average 17.4% |
| Arabs | 40.7 /100 | #182 | Average 17.4% |
| Lebanese | 40.3 /100 | #183 | Average 17.4% |
| Immigrants | Costa Rica | 39.0 /100 | #184 | Fair 17.4% |
| Immigrants | Armenia | 38.0 /100 | #185 | Fair 17.5% |
| Immigrants | Bosnia and Herzegovina | 35.0 /100 | #186 | Fair 17.5% |
| Kenyans | 34.7 /100 | #187 | Fair 17.5% |
| Carpatho Rusyns | 33.6 /100 | #188 | Fair 17.5% |
| French | 33.6 /100 | #189 | Fair 17.5% |
| Slovaks | 29.2 /100 | #190 | Fair 17.6% |
| Immigrants | Afghanistan | 27.9 /100 | #191 | Fair 17.7% |
| Immigrants | Uruguay | 27.8 /100 | #192 | Fair 17.7% |
| Immigrants | Uganda | 25.0 /100 | #193 | Fair 17.7% |
| French Canadians | 24.6 /100 | #194 | Fair 17.7% |
| Sierra Leoneans | 24.1 /100 | #195 | Fair 17.7% |
Demographics Similar to Immigrants from Australia by Child Poverty Under the Age of 5
In terms of child poverty under the age of 5, the demographic groups most similar to Immigrants from Australia are Immigrants from Belarus (14.7%, a difference of 0.12%), Soviet Union (14.7%, a difference of 0.28%), Immigrants from Greece (14.7%, a difference of 0.28%), Eastern European (14.6%, a difference of 0.29%), and Norwegian (14.6%, a difference of 0.29%).
| Demographics | Rating | Rank | Child Poverty Under the Age of 5 |
| Taiwanese | 99.8 /100 | #33 | Exceptional 14.5% |
| Immigrants | Moldova | 99.8 /100 | #34 | Exceptional 14.5% |
| Latvians | 99.8 /100 | #35 | Exceptional 14.5% |
| Maltese | 99.8 /100 | #36 | Exceptional 14.5% |
| Turks | 99.7 /100 | #37 | Exceptional 14.6% |
| Eastern Europeans | 99.7 /100 | #38 | Exceptional 14.6% |
| Norwegians | 99.7 /100 | #39 | Exceptional 14.6% |
| Immigrants | Australia | 99.7 /100 | #40 | Exceptional 14.6% |
| Immigrants | Belarus | 99.7 /100 | #41 | Exceptional 14.7% |
| Soviet Union | 99.7 /100 | #42 | Exceptional 14.7% |
| Immigrants | Greece | 99.7 /100 | #43 | Exceptional 14.7% |
| Immigrants | Philippines | 99.7 /100 | #44 | Exceptional 14.7% |
| Laotians | 99.6 /100 | #45 | Exceptional 14.7% |
| Tsimshian | 99.6 /100 | #46 | Exceptional 14.7% |
| Russians | 99.6 /100 | #47 | Exceptional 14.8% |