Carpatho Rusyn vs Haitian Householder Income Ages 25 - 44 years
COMPARE
Carpatho Rusyn
Haitian
Householder Income Ages 25 - 44 years
Householder Income Ages 25 - 44 years Comparison
Carpatho Rusyns
Haitians
$99,449
HOUSEHOLDER INCOME AGES 25 - 44 YEARS
93.7/ 100
METRIC RATING
115th/ 347
METRIC RANK
$80,055
HOUSEHOLDER INCOME AGES 25 - 44 YEARS
0.0/ 100
METRIC RATING
307th/ 347
METRIC RANK
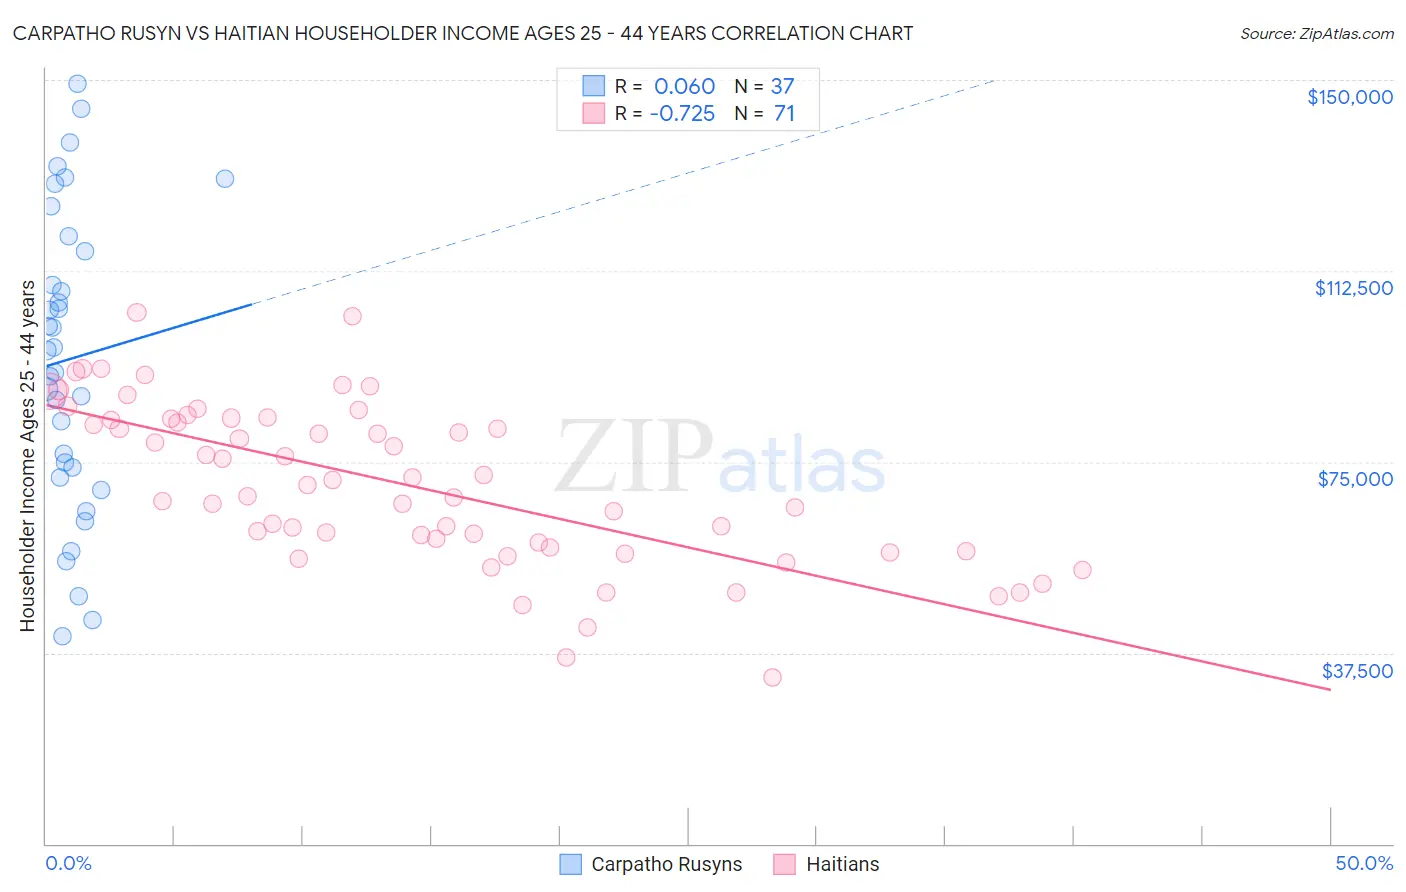
Carpatho Rusyn vs Haitian Householder Income Ages 25 - 44 years Correlation Chart
The statistical analysis conducted on geographies consisting of 58,833,038 people shows a slight positive correlation between the proportion of Carpatho Rusyns and household income with householder between the ages 25 and 44 in the United States with a correlation coefficient (R) of 0.060 and weighted average of $99,449. Similarly, the statistical analysis conducted on geographies consisting of 287,311,076 people shows a strong negative correlation between the proportion of Haitians and household income with householder between the ages 25 and 44 in the United States with a correlation coefficient (R) of -0.725 and weighted average of $80,055, a difference of 24.2%.
Householder Income Ages 25 - 44 years Correlation Summary
| Measurement | Carpatho Rusyn | Haitian |
| Minimum | $40,789 | $32,753 |
| Maximum | $149,241 | $104,312 |
| Range | $108,452 | $71,559 |
| Mean | $95,167 | $70,624 |
| Median | $96,892 | $70,361 |
| Interquartile 25% (IQ1) | $72,857 | $58,114 |
| Interquartile 75% (IQ3) | $117,797 | $83,419 |
| Interquartile Range (IQR) | $44,941 | $25,305 |
| Standard Deviation (Sample) | $29,061 | $15,852 |
| Standard Deviation (Population) | $28,665 | $15,740 |
Similar Demographics by Householder Income Ages 25 - 44 years
Demographics Similar to Carpatho Rusyns by Householder Income Ages 25 - 44 years
In terms of householder income ages 25 - 44 years, the demographic groups most similar to Carpatho Rusyns are Portuguese ($99,429, a difference of 0.020%), Immigrants from Western Asia ($99,516, a difference of 0.070%), Tongan ($99,604, a difference of 0.16%), Immigrants from Northern Africa ($99,232, a difference of 0.22%), and Polish ($99,685, a difference of 0.24%).
| Demographics | Rating | Rank | Householder Income Ages 25 - 44 years |
| Immigrants | South Eastern Asia | 96.0 /100 | #108 | Exceptional $100,283 |
| Immigrants | North Macedonia | 95.6 /100 | #109 | Exceptional $100,101 |
| Immigrants | Afghanistan | 95.3 /100 | #110 | Exceptional $99,977 |
| Chileans | 95.1 /100 | #111 | Exceptional $99,900 |
| Poles | 94.5 /100 | #112 | Exceptional $99,685 |
| Tongans | 94.2 /100 | #113 | Exceptional $99,604 |
| Immigrants | Western Asia | 94.0 /100 | #114 | Exceptional $99,516 |
| Carpatho Rusyns | 93.7 /100 | #115 | Exceptional $99,449 |
| Portuguese | 93.7 /100 | #116 | Exceptional $99,429 |
| Immigrants | Northern Africa | 93.0 /100 | #117 | Exceptional $99,232 |
| Syrians | 92.9 /100 | #118 | Exceptional $99,215 |
| Jordanians | 92.8 /100 | #119 | Exceptional $99,186 |
| Swedes | 92.7 /100 | #120 | Exceptional $99,136 |
| Peruvians | 91.7 /100 | #121 | Exceptional $98,886 |
| Immigrants | Uzbekistan | 91.5 /100 | #122 | Exceptional $98,849 |
Demographics Similar to Haitians by Householder Income Ages 25 - 44 years
In terms of householder income ages 25 - 44 years, the demographic groups most similar to Haitians are Immigrants from Central America ($80,012, a difference of 0.050%), Chippewa ($80,005, a difference of 0.060%), Fijian ($79,956, a difference of 0.12%), Apache ($80,260, a difference of 0.26%), and Immigrants from Dominican Republic ($80,319, a difference of 0.33%).
| Demographics | Rating | Rank | Householder Income Ages 25 - 44 years |
| Cherokee | 0.0 /100 | #300 | Tragic $80,843 |
| Immigrants | Micronesia | 0.0 /100 | #301 | Tragic $80,544 |
| Hispanics or Latinos | 0.0 /100 | #302 | Tragic $80,515 |
| Mexicans | 0.0 /100 | #303 | Tragic $80,427 |
| Immigrants | Caribbean | 0.0 /100 | #304 | Tragic $80,326 |
| Immigrants | Dominican Republic | 0.0 /100 | #305 | Tragic $80,319 |
| Apache | 0.0 /100 | #306 | Tragic $80,260 |
| Haitians | 0.0 /100 | #307 | Tragic $80,055 |
| Immigrants | Central America | 0.0 /100 | #308 | Tragic $80,012 |
| Chippewa | 0.0 /100 | #309 | Tragic $80,005 |
| Fijians | 0.0 /100 | #310 | Tragic $79,956 |
| Indonesians | 0.0 /100 | #311 | Tragic $79,543 |
| Immigrants | Haiti | 0.0 /100 | #312 | Tragic $79,391 |
| Menominee | 0.0 /100 | #313 | Tragic $79,358 |
| Cheyenne | 0.0 /100 | #314 | Tragic $79,152 |