Carpatho Rusyn vs Immigrants from Eastern Asia Householder Income Ages 25 - 44 years
COMPARE
Carpatho Rusyn
Immigrants from Eastern Asia
Householder Income Ages 25 - 44 years
Householder Income Ages 25 - 44 years Comparison
Carpatho Rusyns
Immigrants from Eastern Asia
$99,449
HOUSEHOLDER INCOME AGES 25 - 44 YEARS
93.7/ 100
METRIC RATING
115th/ 347
METRIC RANK
$118,056
HOUSEHOLDER INCOME AGES 25 - 44 YEARS
100.0/ 100
METRIC RATING
13th/ 347
METRIC RANK
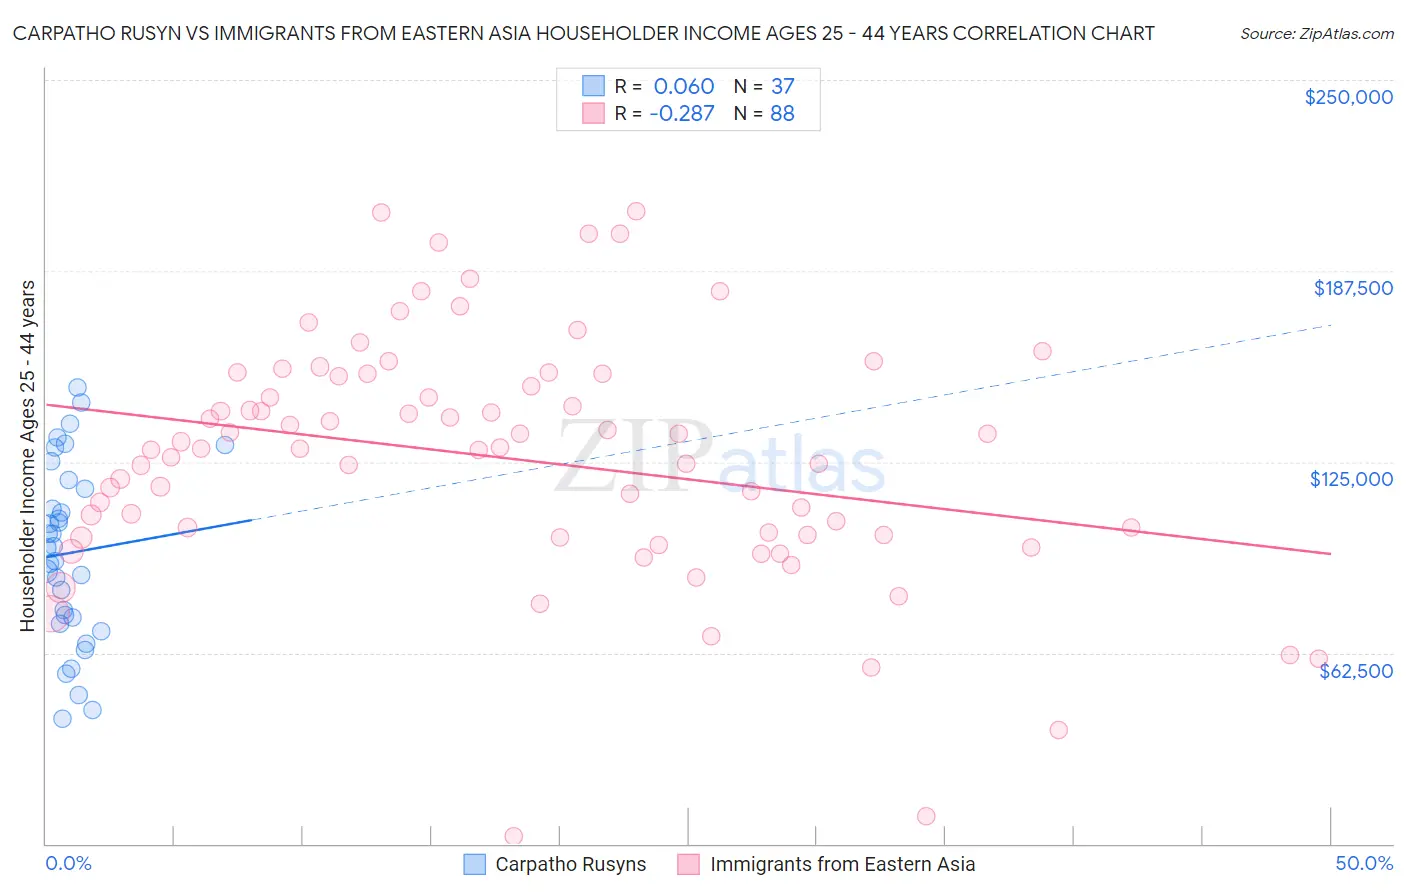
Carpatho Rusyn vs Immigrants from Eastern Asia Householder Income Ages 25 - 44 years Correlation Chart
The statistical analysis conducted on geographies consisting of 58,833,038 people shows a slight positive correlation between the proportion of Carpatho Rusyns and household income with householder between the ages 25 and 44 in the United States with a correlation coefficient (R) of 0.060 and weighted average of $99,449. Similarly, the statistical analysis conducted on geographies consisting of 497,761,527 people shows a weak negative correlation between the proportion of Immigrants from Eastern Asia and household income with householder between the ages 25 and 44 in the United States with a correlation coefficient (R) of -0.287 and weighted average of $118,056, a difference of 18.7%.
Householder Income Ages 25 - 44 years Correlation Summary
| Measurement | Carpatho Rusyn | Immigrants from Eastern Asia |
| Minimum | $40,789 | $2,499 |
| Maximum | $149,241 | $207,000 |
| Range | $108,452 | $204,501 |
| Mean | $95,167 | $126,047 |
| Median | $96,892 | $129,288 |
| Interquartile 25% (IQ1) | $72,857 | $101,055 |
| Interquartile 75% (IQ3) | $117,797 | $153,470 |
| Interquartile Range (IQR) | $44,941 | $52,415 |
| Standard Deviation (Sample) | $29,061 | $39,781 |
| Standard Deviation (Population) | $28,665 | $39,555 |
Similar Demographics by Householder Income Ages 25 - 44 years
Demographics Similar to Carpatho Rusyns by Householder Income Ages 25 - 44 years
In terms of householder income ages 25 - 44 years, the demographic groups most similar to Carpatho Rusyns are Portuguese ($99,429, a difference of 0.020%), Immigrants from Western Asia ($99,516, a difference of 0.070%), Tongan ($99,604, a difference of 0.16%), Immigrants from Northern Africa ($99,232, a difference of 0.22%), and Polish ($99,685, a difference of 0.24%).
| Demographics | Rating | Rank | Householder Income Ages 25 - 44 years |
| Immigrants | South Eastern Asia | 96.0 /100 | #108 | Exceptional $100,283 |
| Immigrants | North Macedonia | 95.6 /100 | #109 | Exceptional $100,101 |
| Immigrants | Afghanistan | 95.3 /100 | #110 | Exceptional $99,977 |
| Chileans | 95.1 /100 | #111 | Exceptional $99,900 |
| Poles | 94.5 /100 | #112 | Exceptional $99,685 |
| Tongans | 94.2 /100 | #113 | Exceptional $99,604 |
| Immigrants | Western Asia | 94.0 /100 | #114 | Exceptional $99,516 |
| Carpatho Rusyns | 93.7 /100 | #115 | Exceptional $99,449 |
| Portuguese | 93.7 /100 | #116 | Exceptional $99,429 |
| Immigrants | Northern Africa | 93.0 /100 | #117 | Exceptional $99,232 |
| Syrians | 92.9 /100 | #118 | Exceptional $99,215 |
| Jordanians | 92.8 /100 | #119 | Exceptional $99,186 |
| Swedes | 92.7 /100 | #120 | Exceptional $99,136 |
| Peruvians | 91.7 /100 | #121 | Exceptional $98,886 |
| Immigrants | Uzbekistan | 91.5 /100 | #122 | Exceptional $98,849 |
Demographics Similar to Immigrants from Eastern Asia by Householder Income Ages 25 - 44 years
In terms of householder income ages 25 - 44 years, the demographic groups most similar to Immigrants from Eastern Asia are Immigrants from Israel ($117,219, a difference of 0.71%), Immigrants from Iran ($119,204, a difference of 0.97%), Okinawan ($119,349, a difference of 1.1%), Indian (Asian) ($119,496, a difference of 1.2%), and Immigrants from South Central Asia ($116,626, a difference of 1.2%).
| Demographics | Rating | Rank | Householder Income Ages 25 - 44 years |
| Thais | 100.0 /100 | #6 | Exceptional $121,778 |
| Immigrants | Ireland | 100.0 /100 | #7 | Exceptional $120,333 |
| Iranians | 100.0 /100 | #8 | Exceptional $120,292 |
| Immigrants | China | 100.0 /100 | #9 | Exceptional $119,756 |
| Indians (Asian) | 100.0 /100 | #10 | Exceptional $119,496 |
| Okinawans | 100.0 /100 | #11 | Exceptional $119,349 |
| Immigrants | Iran | 100.0 /100 | #12 | Exceptional $119,204 |
| Immigrants | Eastern Asia | 100.0 /100 | #13 | Exceptional $118,056 |
| Immigrants | Israel | 100.0 /100 | #14 | Exceptional $117,219 |
| Immigrants | South Central Asia | 100.0 /100 | #15 | Exceptional $116,626 |
| Cypriots | 100.0 /100 | #16 | Exceptional $116,364 |
| Immigrants | Australia | 100.0 /100 | #17 | Exceptional $115,947 |
| Eastern Europeans | 100.0 /100 | #18 | Exceptional $114,523 |
| Burmese | 100.0 /100 | #19 | Exceptional $113,701 |
| Immigrants | Korea | 100.0 /100 | #20 | Exceptional $113,401 |