Carpatho Rusyn vs French Canadian Householder Income Ages 25 - 44 years
COMPARE
Carpatho Rusyn
French Canadian
Householder Income Ages 25 - 44 years
Householder Income Ages 25 - 44 years Comparison
Carpatho Rusyns
French Canadians
$99,449
HOUSEHOLDER INCOME AGES 25 - 44 YEARS
93.7/ 100
METRIC RATING
115th/ 347
METRIC RANK
$93,694
HOUSEHOLDER INCOME AGES 25 - 44 YEARS
38.2/ 100
METRIC RATING
179th/ 347
METRIC RANK
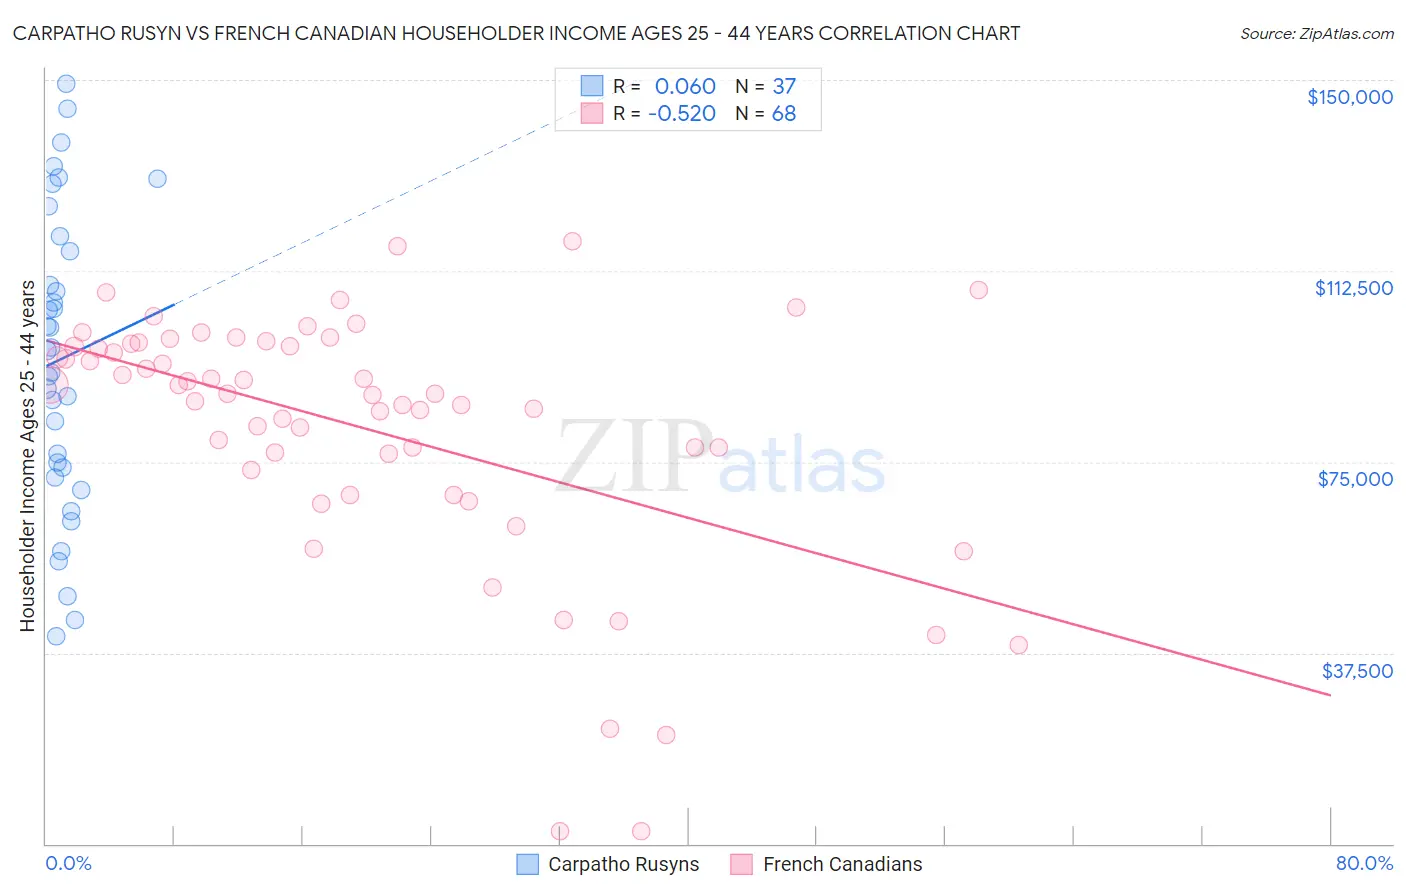
Carpatho Rusyn vs French Canadian Householder Income Ages 25 - 44 years Correlation Chart
The statistical analysis conducted on geographies consisting of 58,833,038 people shows a slight positive correlation between the proportion of Carpatho Rusyns and household income with householder between the ages 25 and 44 in the United States with a correlation coefficient (R) of 0.060 and weighted average of $99,449. Similarly, the statistical analysis conducted on geographies consisting of 499,836,876 people shows a substantial negative correlation between the proportion of French Canadians and household income with householder between the ages 25 and 44 in the United States with a correlation coefficient (R) of -0.520 and weighted average of $93,694, a difference of 6.1%.
Householder Income Ages 25 - 44 years Correlation Summary
| Measurement | Carpatho Rusyn | French Canadian |
| Minimum | $40,789 | $2,499 |
| Maximum | $149,241 | $118,309 |
| Range | $108,452 | $115,810 |
| Mean | $95,167 | $81,603 |
| Median | $96,892 | $88,389 |
| Interquartile 25% (IQ1) | $72,857 | $74,933 |
| Interquartile 75% (IQ3) | $117,797 | $98,053 |
| Interquartile Range (IQR) | $44,941 | $23,120 |
| Standard Deviation (Sample) | $29,061 | $24,791 |
| Standard Deviation (Population) | $28,665 | $24,608 |
Similar Demographics by Householder Income Ages 25 - 44 years
Demographics Similar to Carpatho Rusyns by Householder Income Ages 25 - 44 years
In terms of householder income ages 25 - 44 years, the demographic groups most similar to Carpatho Rusyns are Portuguese ($99,429, a difference of 0.020%), Immigrants from Western Asia ($99,516, a difference of 0.070%), Tongan ($99,604, a difference of 0.16%), Immigrants from Northern Africa ($99,232, a difference of 0.22%), and Polish ($99,685, a difference of 0.24%).
| Demographics | Rating | Rank | Householder Income Ages 25 - 44 years |
| Immigrants | South Eastern Asia | 96.0 /100 | #108 | Exceptional $100,283 |
| Immigrants | North Macedonia | 95.6 /100 | #109 | Exceptional $100,101 |
| Immigrants | Afghanistan | 95.3 /100 | #110 | Exceptional $99,977 |
| Chileans | 95.1 /100 | #111 | Exceptional $99,900 |
| Poles | 94.5 /100 | #112 | Exceptional $99,685 |
| Tongans | 94.2 /100 | #113 | Exceptional $99,604 |
| Immigrants | Western Asia | 94.0 /100 | #114 | Exceptional $99,516 |
| Carpatho Rusyns | 93.7 /100 | #115 | Exceptional $99,449 |
| Portuguese | 93.7 /100 | #116 | Exceptional $99,429 |
| Immigrants | Northern Africa | 93.0 /100 | #117 | Exceptional $99,232 |
| Syrians | 92.9 /100 | #118 | Exceptional $99,215 |
| Jordanians | 92.8 /100 | #119 | Exceptional $99,186 |
| Swedes | 92.7 /100 | #120 | Exceptional $99,136 |
| Peruvians | 91.7 /100 | #121 | Exceptional $98,886 |
| Immigrants | Uzbekistan | 91.5 /100 | #122 | Exceptional $98,849 |
Demographics Similar to French Canadians by Householder Income Ages 25 - 44 years
In terms of householder income ages 25 - 44 years, the demographic groups most similar to French Canadians are French ($93,665, a difference of 0.030%), Puget Sound Salish ($93,661, a difference of 0.040%), Uruguayan ($93,631, a difference of 0.070%), Guamanian/Chamorro ($93,569, a difference of 0.13%), and German ($93,531, a difference of 0.18%).
| Demographics | Rating | Rank | Householder Income Ages 25 - 44 years |
| Scottish | 50.8 /100 | #172 | Average $94,622 |
| Finns | 50.6 /100 | #173 | Average $94,610 |
| Colombians | 50.0 /100 | #174 | Average $94,565 |
| English | 48.1 /100 | #175 | Average $94,429 |
| Immigrants | Immigrants | 48.0 /100 | #176 | Average $94,423 |
| Belgians | 45.8 /100 | #177 | Average $94,262 |
| Immigrants | South America | 42.8 /100 | #178 | Average $94,042 |
| French Canadians | 38.2 /100 | #179 | Fair $93,694 |
| French | 37.8 /100 | #180 | Fair $93,665 |
| Puget Sound Salish | 37.7 /100 | #181 | Fair $93,661 |
| Uruguayans | 37.3 /100 | #182 | Fair $93,631 |
| Guamanians/Chamorros | 36.5 /100 | #183 | Fair $93,569 |
| Germans | 36.0 /100 | #184 | Fair $93,531 |
| Immigrants | Eritrea | 35.2 /100 | #185 | Fair $93,466 |
| Sierra Leoneans | 34.8 /100 | #186 | Fair $93,435 |