Carpatho Rusyn vs Turkish Householder Income Ages 25 - 44 years
COMPARE
Carpatho Rusyn
Turkish
Householder Income Ages 25 - 44 years
Householder Income Ages 25 - 44 years Comparison
Carpatho Rusyns
Turks
$99,449
HOUSEHOLDER INCOME AGES 25 - 44 YEARS
93.7/ 100
METRIC RATING
115th/ 347
METRIC RANK
$110,318
HOUSEHOLDER INCOME AGES 25 - 44 YEARS
100.0/ 100
METRIC RATING
29th/ 347
METRIC RANK
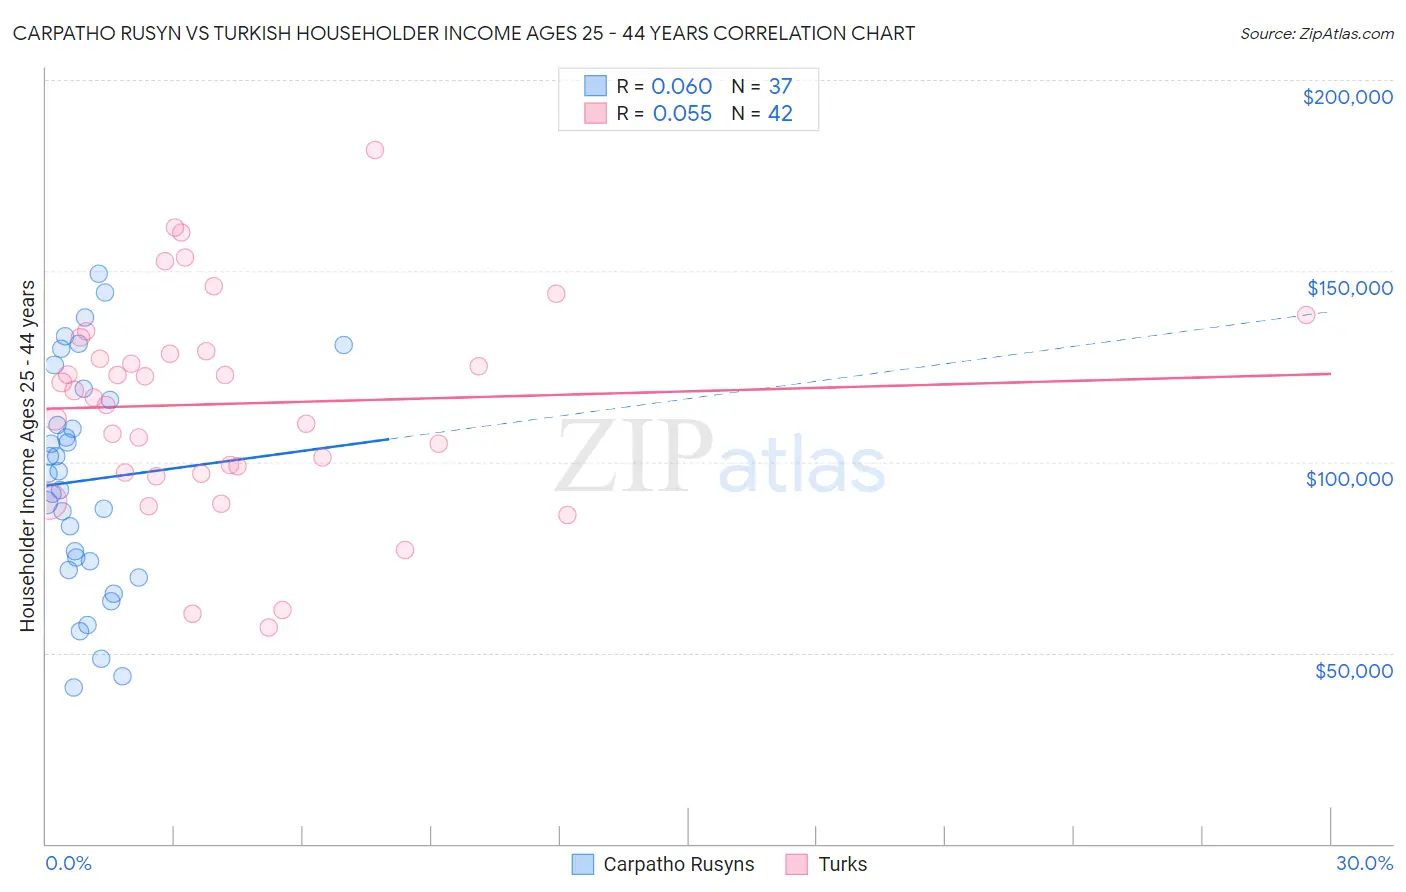
Carpatho Rusyn vs Turkish Householder Income Ages 25 - 44 years Correlation Chart
The statistical analysis conducted on geographies consisting of 58,833,038 people shows a slight positive correlation between the proportion of Carpatho Rusyns and household income with householder between the ages 25 and 44 in the United States with a correlation coefficient (R) of 0.060 and weighted average of $99,449. Similarly, the statistical analysis conducted on geographies consisting of 271,426,496 people shows a slight positive correlation between the proportion of Turks and household income with householder between the ages 25 and 44 in the United States with a correlation coefficient (R) of 0.055 and weighted average of $110,318, a difference of 10.9%.
Householder Income Ages 25 - 44 years Correlation Summary
| Measurement | Carpatho Rusyn | Turkish |
| Minimum | $40,789 | $56,649 |
| Maximum | $149,241 | $181,667 |
| Range | $108,452 | $125,018 |
| Mean | $95,167 | $115,234 |
| Median | $96,892 | $117,840 |
| Interquartile 25% (IQ1) | $72,857 | $97,323 |
| Interquartile 75% (IQ3) | $117,797 | $128,924 |
| Interquartile Range (IQR) | $44,941 | $31,602 |
| Standard Deviation (Sample) | $29,061 | $27,559 |
| Standard Deviation (Population) | $28,665 | $27,229 |
Similar Demographics by Householder Income Ages 25 - 44 years
Demographics Similar to Carpatho Rusyns by Householder Income Ages 25 - 44 years
In terms of householder income ages 25 - 44 years, the demographic groups most similar to Carpatho Rusyns are Portuguese ($99,429, a difference of 0.020%), Immigrants from Western Asia ($99,516, a difference of 0.070%), Tongan ($99,604, a difference of 0.16%), Immigrants from Northern Africa ($99,232, a difference of 0.22%), and Polish ($99,685, a difference of 0.24%).
| Demographics | Rating | Rank | Householder Income Ages 25 - 44 years |
| Immigrants | South Eastern Asia | 96.0 /100 | #108 | Exceptional $100,283 |
| Immigrants | North Macedonia | 95.6 /100 | #109 | Exceptional $100,101 |
| Immigrants | Afghanistan | 95.3 /100 | #110 | Exceptional $99,977 |
| Chileans | 95.1 /100 | #111 | Exceptional $99,900 |
| Poles | 94.5 /100 | #112 | Exceptional $99,685 |
| Tongans | 94.2 /100 | #113 | Exceptional $99,604 |
| Immigrants | Western Asia | 94.0 /100 | #114 | Exceptional $99,516 |
| Carpatho Rusyns | 93.7 /100 | #115 | Exceptional $99,449 |
| Portuguese | 93.7 /100 | #116 | Exceptional $99,429 |
| Immigrants | Northern Africa | 93.0 /100 | #117 | Exceptional $99,232 |
| Syrians | 92.9 /100 | #118 | Exceptional $99,215 |
| Jordanians | 92.8 /100 | #119 | Exceptional $99,186 |
| Swedes | 92.7 /100 | #120 | Exceptional $99,136 |
| Peruvians | 91.7 /100 | #121 | Exceptional $98,886 |
| Immigrants | Uzbekistan | 91.5 /100 | #122 | Exceptional $98,849 |
Demographics Similar to Turks by Householder Income Ages 25 - 44 years
In terms of householder income ages 25 - 44 years, the demographic groups most similar to Turks are Immigrants from Denmark ($110,363, a difference of 0.040%), Russian ($110,398, a difference of 0.070%), Immigrants from Greece ($110,103, a difference of 0.20%), Maltese ($110,064, a difference of 0.23%), and Immigrants from Asia ($110,787, a difference of 0.42%).
| Demographics | Rating | Rank | Householder Income Ages 25 - 44 years |
| Immigrants | Belgium | 100.0 /100 | #22 | Exceptional $112,575 |
| Immigrants | Japan | 100.0 /100 | #23 | Exceptional $112,228 |
| Immigrants | Sweden | 100.0 /100 | #24 | Exceptional $112,010 |
| Immigrants | Northern Europe | 100.0 /100 | #25 | Exceptional $111,676 |
| Immigrants | Asia | 100.0 /100 | #26 | Exceptional $110,787 |
| Russians | 100.0 /100 | #27 | Exceptional $110,398 |
| Immigrants | Denmark | 100.0 /100 | #28 | Exceptional $110,363 |
| Turks | 100.0 /100 | #29 | Exceptional $110,318 |
| Immigrants | Greece | 100.0 /100 | #30 | Exceptional $110,103 |
| Maltese | 100.0 /100 | #31 | Exceptional $110,064 |
| Immigrants | Sri Lanka | 100.0 /100 | #32 | Exceptional $109,741 |
| Bhutanese | 100.0 /100 | #33 | Exceptional $109,520 |
| Bolivians | 100.0 /100 | #34 | Exceptional $109,372 |
| Immigrants | Switzerland | 100.0 /100 | #35 | Exceptional $109,185 |
| Latvians | 100.0 /100 | #36 | Exceptional $108,926 |