Immigrants from Nigeria vs Haitian Householder Income Ages 25 - 44 years
COMPARE
Immigrants from Nigeria
Haitian
Householder Income Ages 25 - 44 years
Householder Income Ages 25 - 44 years Comparison
Immigrants from Nigeria
Haitians
$86,589
HOUSEHOLDER INCOME AGES 25 - 44 YEARS
1.2/ 100
METRIC RATING
247th/ 347
METRIC RANK
$80,055
HOUSEHOLDER INCOME AGES 25 - 44 YEARS
0.0/ 100
METRIC RATING
307th/ 347
METRIC RANK
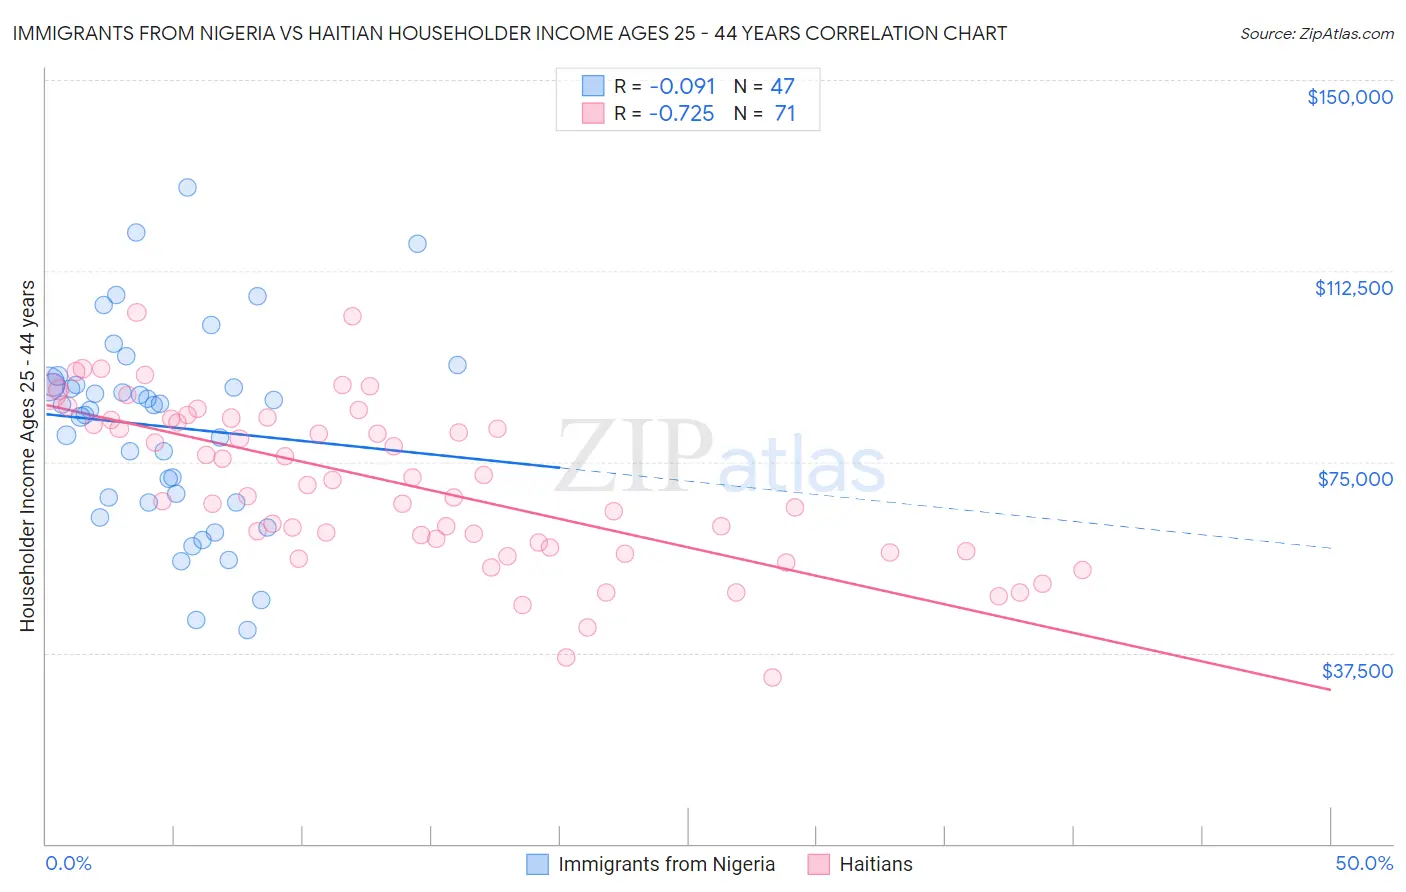
Immigrants from Nigeria vs Haitian Householder Income Ages 25 - 44 years Correlation Chart
The statistical analysis conducted on geographies consisting of 283,094,597 people shows a slight negative correlation between the proportion of Immigrants from Nigeria and household income with householder between the ages 25 and 44 in the United States with a correlation coefficient (R) of -0.091 and weighted average of $86,589. Similarly, the statistical analysis conducted on geographies consisting of 287,311,076 people shows a strong negative correlation between the proportion of Haitians and household income with householder between the ages 25 and 44 in the United States with a correlation coefficient (R) of -0.725 and weighted average of $80,055, a difference of 8.2%.
Householder Income Ages 25 - 44 years Correlation Summary
| Measurement | Immigrants from Nigeria | Haitian |
| Minimum | $42,092 | $32,753 |
| Maximum | $128,882 | $104,312 |
| Range | $86,790 | $71,559 |
| Mean | $81,924 | $70,624 |
| Median | $86,086 | $70,361 |
| Interquartile 25% (IQ1) | $67,086 | $58,114 |
| Interquartile 75% (IQ3) | $90,392 | $83,419 |
| Interquartile Range (IQR) | $23,305 | $25,305 |
| Standard Deviation (Sample) | $19,417 | $15,852 |
| Standard Deviation (Population) | $19,209 | $15,740 |
Similar Demographics by Householder Income Ages 25 - 44 years
Demographics Similar to Immigrants from Nigeria by Householder Income Ages 25 - 44 years
In terms of householder income ages 25 - 44 years, the demographic groups most similar to Immigrants from Nigeria are Immigrants from Burma/Myanmar ($86,736, a difference of 0.17%), Immigrants from El Salvador ($86,913, a difference of 0.37%), Immigrants from Venezuela ($87,038, a difference of 0.52%), Immigrants from West Indies ($87,063, a difference of 0.55%), and Immigrants from Sudan ($86,109, a difference of 0.56%).
| Demographics | Rating | Rank | Householder Income Ages 25 - 44 years |
| Nicaraguans | 2.2 /100 | #240 | Tragic $87,751 |
| Nigerians | 2.2 /100 | #241 | Tragic $87,730 |
| West Indians | 1.7 /100 | #242 | Tragic $87,205 |
| Immigrants | West Indies | 1.5 /100 | #243 | Tragic $87,063 |
| Immigrants | Venezuela | 1.5 /100 | #244 | Tragic $87,038 |
| Immigrants | El Salvador | 1.4 /100 | #245 | Tragic $86,913 |
| Immigrants | Burma/Myanmar | 1.3 /100 | #246 | Tragic $86,736 |
| Immigrants | Nigeria | 1.2 /100 | #247 | Tragic $86,589 |
| Immigrants | Sudan | 0.9 /100 | #248 | Tragic $86,109 |
| French American Indians | 0.8 /100 | #249 | Tragic $85,899 |
| Pennsylvania Germans | 0.8 /100 | #250 | Tragic $85,836 |
| Cape Verdeans | 0.8 /100 | #251 | Tragic $85,758 |
| Immigrants | Western Africa | 0.7 /100 | #252 | Tragic $85,676 |
| British West Indians | 0.7 /100 | #253 | Tragic $85,565 |
| Immigrants | Laos | 0.7 /100 | #254 | Tragic $85,553 |
Demographics Similar to Haitians by Householder Income Ages 25 - 44 years
In terms of householder income ages 25 - 44 years, the demographic groups most similar to Haitians are Immigrants from Central America ($80,012, a difference of 0.050%), Chippewa ($80,005, a difference of 0.060%), Fijian ($79,956, a difference of 0.12%), Apache ($80,260, a difference of 0.26%), and Immigrants from Dominican Republic ($80,319, a difference of 0.33%).
| Demographics | Rating | Rank | Householder Income Ages 25 - 44 years |
| Cherokee | 0.0 /100 | #300 | Tragic $80,843 |
| Immigrants | Micronesia | 0.0 /100 | #301 | Tragic $80,544 |
| Hispanics or Latinos | 0.0 /100 | #302 | Tragic $80,515 |
| Mexicans | 0.0 /100 | #303 | Tragic $80,427 |
| Immigrants | Caribbean | 0.0 /100 | #304 | Tragic $80,326 |
| Immigrants | Dominican Republic | 0.0 /100 | #305 | Tragic $80,319 |
| Apache | 0.0 /100 | #306 | Tragic $80,260 |
| Haitians | 0.0 /100 | #307 | Tragic $80,055 |
| Immigrants | Central America | 0.0 /100 | #308 | Tragic $80,012 |
| Chippewa | 0.0 /100 | #309 | Tragic $80,005 |
| Fijians | 0.0 /100 | #310 | Tragic $79,956 |
| Indonesians | 0.0 /100 | #311 | Tragic $79,543 |
| Immigrants | Haiti | 0.0 /100 | #312 | Tragic $79,391 |
| Menominee | 0.0 /100 | #313 | Tragic $79,358 |
| Cheyenne | 0.0 /100 | #314 | Tragic $79,152 |