Potawatomi vs Haitian Householder Income Ages 25 - 44 years
COMPARE
Potawatomi
Haitian
Householder Income Ages 25 - 44 years
Householder Income Ages 25 - 44 years Comparison
Potawatomi
Haitians
$81,774
HOUSEHOLDER INCOME AGES 25 - 44 YEARS
0.1/ 100
METRIC RATING
291st/ 347
METRIC RANK
$80,055
HOUSEHOLDER INCOME AGES 25 - 44 YEARS
0.0/ 100
METRIC RATING
307th/ 347
METRIC RANK
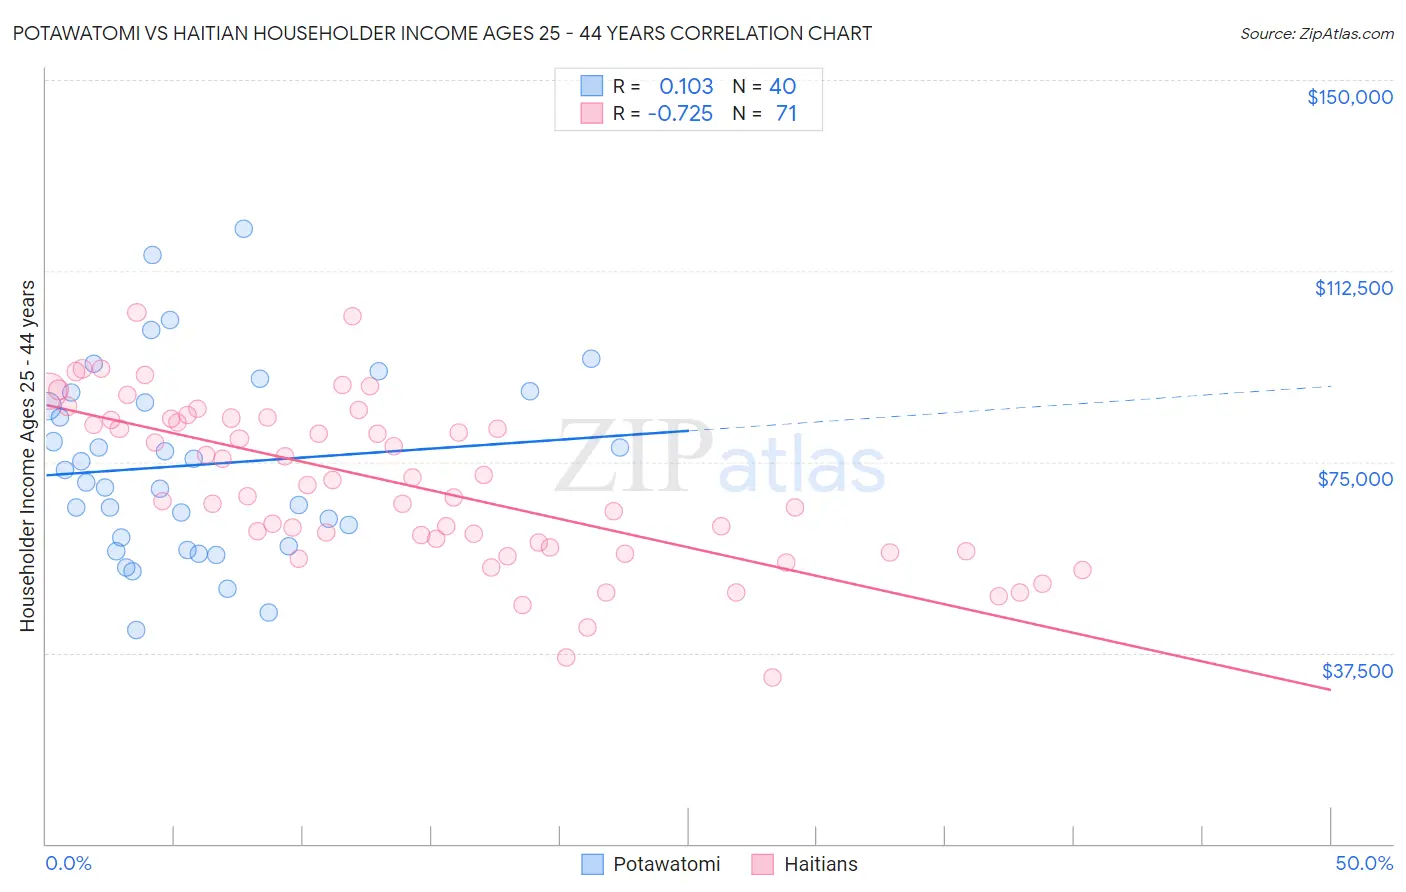
Potawatomi vs Haitian Householder Income Ages 25 - 44 years Correlation Chart
The statistical analysis conducted on geographies consisting of 117,622,599 people shows a poor positive correlation between the proportion of Potawatomi and household income with householder between the ages 25 and 44 in the United States with a correlation coefficient (R) of 0.103 and weighted average of $81,774. Similarly, the statistical analysis conducted on geographies consisting of 287,311,076 people shows a strong negative correlation between the proportion of Haitians and household income with householder between the ages 25 and 44 in the United States with a correlation coefficient (R) of -0.725 and weighted average of $80,055, a difference of 2.1%.
Householder Income Ages 25 - 44 years Correlation Summary
| Measurement | Potawatomi | Haitian |
| Minimum | $41,983 | $32,753 |
| Maximum | $120,714 | $104,312 |
| Range | $78,731 | $71,559 |
| Mean | $74,403 | $70,624 |
| Median | $72,124 | $70,361 |
| Interquartile 25% (IQ1) | $59,264 | $58,114 |
| Interquartile 75% (IQ3) | $87,578 | $83,419 |
| Interquartile Range (IQR) | $28,314 | $25,305 |
| Standard Deviation (Sample) | $18,398 | $15,852 |
| Standard Deviation (Population) | $18,166 | $15,740 |
Demographics Similar to Potawatomi and Haitians by Householder Income Ages 25 - 44 years
In terms of householder income ages 25 - 44 years, the demographic groups most similar to Potawatomi are Yaqui ($81,656, a difference of 0.14%), Liberian ($82,005, a difference of 0.28%), Blackfeet ($81,531, a difference of 0.30%), Shoshone ($82,062, a difference of 0.35%), and Cuban ($81,483, a difference of 0.36%). Similarly, the demographic groups most similar to Haitians are Immigrants from Central America ($80,012, a difference of 0.050%), Chippewa ($80,005, a difference of 0.060%), Apache ($80,260, a difference of 0.26%), Immigrants from Dominican Republic ($80,319, a difference of 0.33%), and Immigrants from Caribbean ($80,326, a difference of 0.34%).
| Demographics | Rating | Rank | Householder Income Ages 25 - 44 years |
| Shoshone | 0.1 /100 | #289 | Tragic $82,062 |
| Liberians | 0.1 /100 | #290 | Tragic $82,005 |
| Potawatomi | 0.1 /100 | #291 | Tragic $81,774 |
| Yaqui | 0.1 /100 | #292 | Tragic $81,656 |
| Blackfeet | 0.1 /100 | #293 | Tragic $81,531 |
| Cubans | 0.1 /100 | #294 | Tragic $81,483 |
| Bangladeshis | 0.1 /100 | #295 | Tragic $81,363 |
| Immigrants | Dominica | 0.1 /100 | #296 | Tragic $81,351 |
| Immigrants | Guatemala | 0.1 /100 | #297 | Tragic $81,341 |
| Dominicans | 0.1 /100 | #298 | Tragic $81,229 |
| Immigrants | Liberia | 0.1 /100 | #299 | Tragic $80,863 |
| Cherokee | 0.0 /100 | #300 | Tragic $80,843 |
| Immigrants | Micronesia | 0.0 /100 | #301 | Tragic $80,544 |
| Hispanics or Latinos | 0.0 /100 | #302 | Tragic $80,515 |
| Mexicans | 0.0 /100 | #303 | Tragic $80,427 |
| Immigrants | Caribbean | 0.0 /100 | #304 | Tragic $80,326 |
| Immigrants | Dominican Republic | 0.0 /100 | #305 | Tragic $80,319 |
| Apache | 0.0 /100 | #306 | Tragic $80,260 |
| Haitians | 0.0 /100 | #307 | Tragic $80,055 |
| Immigrants | Central America | 0.0 /100 | #308 | Tragic $80,012 |
| Chippewa | 0.0 /100 | #309 | Tragic $80,005 |