Israeli vs Haitian Householder Income Ages 25 - 44 years
COMPARE
Israeli
Haitian
Householder Income Ages 25 - 44 years
Householder Income Ages 25 - 44 years Comparison
Israelis
Haitians
$107,579
HOUSEHOLDER INCOME AGES 25 - 44 YEARS
99.9/ 100
METRIC RATING
45th/ 347
METRIC RANK
$80,055
HOUSEHOLDER INCOME AGES 25 - 44 YEARS
0.0/ 100
METRIC RATING
307th/ 347
METRIC RANK
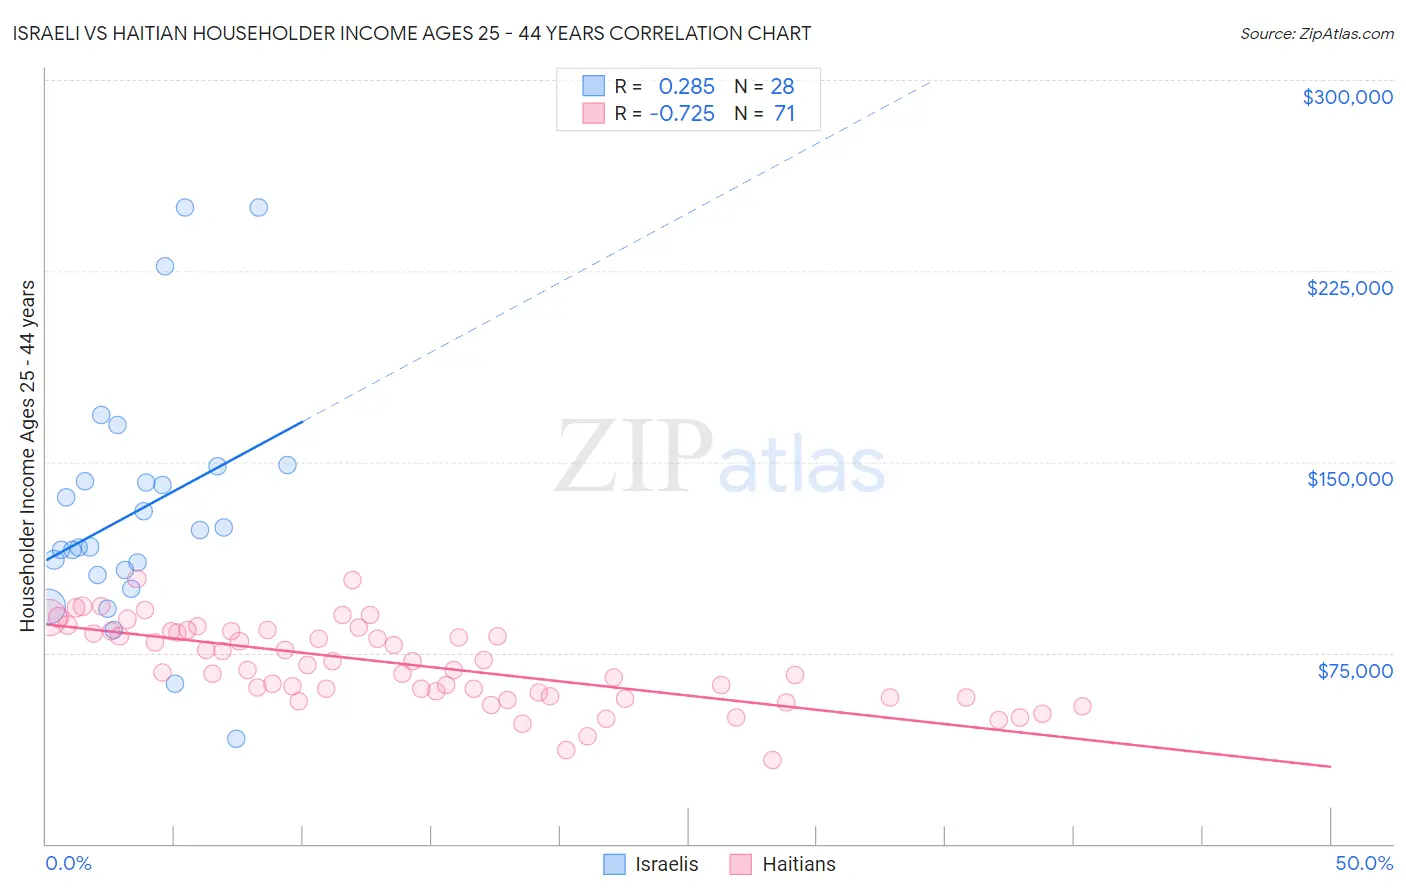
Israeli vs Haitian Householder Income Ages 25 - 44 years Correlation Chart
The statistical analysis conducted on geographies consisting of 210,632,541 people shows a weak positive correlation between the proportion of Israelis and household income with householder between the ages 25 and 44 in the United States with a correlation coefficient (R) of 0.285 and weighted average of $107,579. Similarly, the statistical analysis conducted on geographies consisting of 287,311,076 people shows a strong negative correlation between the proportion of Haitians and household income with householder between the ages 25 and 44 in the United States with a correlation coefficient (R) of -0.725 and weighted average of $80,055, a difference of 34.4%.
Householder Income Ages 25 - 44 years Correlation Summary
| Measurement | Israeli | Haitian |
| Minimum | $41,080 | $32,753 |
| Maximum | $250,001 | $104,312 |
| Range | $208,921 | $71,559 |
| Mean | $131,021 | $70,624 |
| Median | $119,912 | $70,361 |
| Interquartile 25% (IQ1) | $106,515 | $58,114 |
| Interquartile 75% (IQ3) | $145,332 | $83,419 |
| Interquartile Range (IQR) | $38,818 | $25,305 |
| Standard Deviation (Sample) | $48,252 | $15,852 |
| Standard Deviation (Population) | $47,383 | $15,740 |
Similar Demographics by Householder Income Ages 25 - 44 years
Demographics Similar to Israelis by Householder Income Ages 25 - 44 years
In terms of householder income ages 25 - 44 years, the demographic groups most similar to Israelis are Immigrants from Indonesia ($107,627, a difference of 0.040%), Immigrants from Malaysia ($107,650, a difference of 0.070%), Immigrants from Belarus ($107,393, a difference of 0.17%), Estonian ($107,269, a difference of 0.29%), and Bulgarian ($107,264, a difference of 0.29%).
| Demographics | Rating | Rank | Householder Income Ages 25 - 44 years |
| Soviet Union | 100.0 /100 | #38 | Exceptional $108,457 |
| Immigrants | France | 99.9 /100 | #39 | Exceptional $108,257 |
| Immigrants | Lithuania | 99.9 /100 | #40 | Exceptional $108,149 |
| Immigrants | Bolivia | 99.9 /100 | #41 | Exceptional $108,128 |
| Australians | 99.9 /100 | #42 | Exceptional $107,912 |
| Immigrants | Malaysia | 99.9 /100 | #43 | Exceptional $107,650 |
| Immigrants | Indonesia | 99.9 /100 | #44 | Exceptional $107,627 |
| Israelis | 99.9 /100 | #45 | Exceptional $107,579 |
| Immigrants | Belarus | 99.9 /100 | #46 | Exceptional $107,393 |
| Estonians | 99.9 /100 | #47 | Exceptional $107,269 |
| Bulgarians | 99.9 /100 | #48 | Exceptional $107,264 |
| Immigrants | Turkey | 99.9 /100 | #49 | Exceptional $107,258 |
| Cambodians | 99.9 /100 | #50 | Exceptional $107,148 |
| Immigrants | Czechoslovakia | 99.9 /100 | #51 | Exceptional $106,888 |
| Immigrants | Europe | 99.9 /100 | #52 | Exceptional $106,817 |
Demographics Similar to Haitians by Householder Income Ages 25 - 44 years
In terms of householder income ages 25 - 44 years, the demographic groups most similar to Haitians are Immigrants from Central America ($80,012, a difference of 0.050%), Chippewa ($80,005, a difference of 0.060%), Fijian ($79,956, a difference of 0.12%), Apache ($80,260, a difference of 0.26%), and Immigrants from Dominican Republic ($80,319, a difference of 0.33%).
| Demographics | Rating | Rank | Householder Income Ages 25 - 44 years |
| Cherokee | 0.0 /100 | #300 | Tragic $80,843 |
| Immigrants | Micronesia | 0.0 /100 | #301 | Tragic $80,544 |
| Hispanics or Latinos | 0.0 /100 | #302 | Tragic $80,515 |
| Mexicans | 0.0 /100 | #303 | Tragic $80,427 |
| Immigrants | Caribbean | 0.0 /100 | #304 | Tragic $80,326 |
| Immigrants | Dominican Republic | 0.0 /100 | #305 | Tragic $80,319 |
| Apache | 0.0 /100 | #306 | Tragic $80,260 |
| Haitians | 0.0 /100 | #307 | Tragic $80,055 |
| Immigrants | Central America | 0.0 /100 | #308 | Tragic $80,012 |
| Chippewa | 0.0 /100 | #309 | Tragic $80,005 |
| Fijians | 0.0 /100 | #310 | Tragic $79,956 |
| Indonesians | 0.0 /100 | #311 | Tragic $79,543 |
| Immigrants | Haiti | 0.0 /100 | #312 | Tragic $79,391 |
| Menominee | 0.0 /100 | #313 | Tragic $79,358 |
| Cheyenne | 0.0 /100 | #314 | Tragic $79,152 |