Immigrants from Italy vs Haitian Householder Income Ages 25 - 44 years
COMPARE
Immigrants from Italy
Haitian
Householder Income Ages 25 - 44 years
Householder Income Ages 25 - 44 years Comparison
Immigrants from Italy
Haitians
$105,201
HOUSEHOLDER INCOME AGES 25 - 44 YEARS
99.7/ 100
METRIC RATING
62nd/ 347
METRIC RANK
$80,055
HOUSEHOLDER INCOME AGES 25 - 44 YEARS
0.0/ 100
METRIC RATING
307th/ 347
METRIC RANK
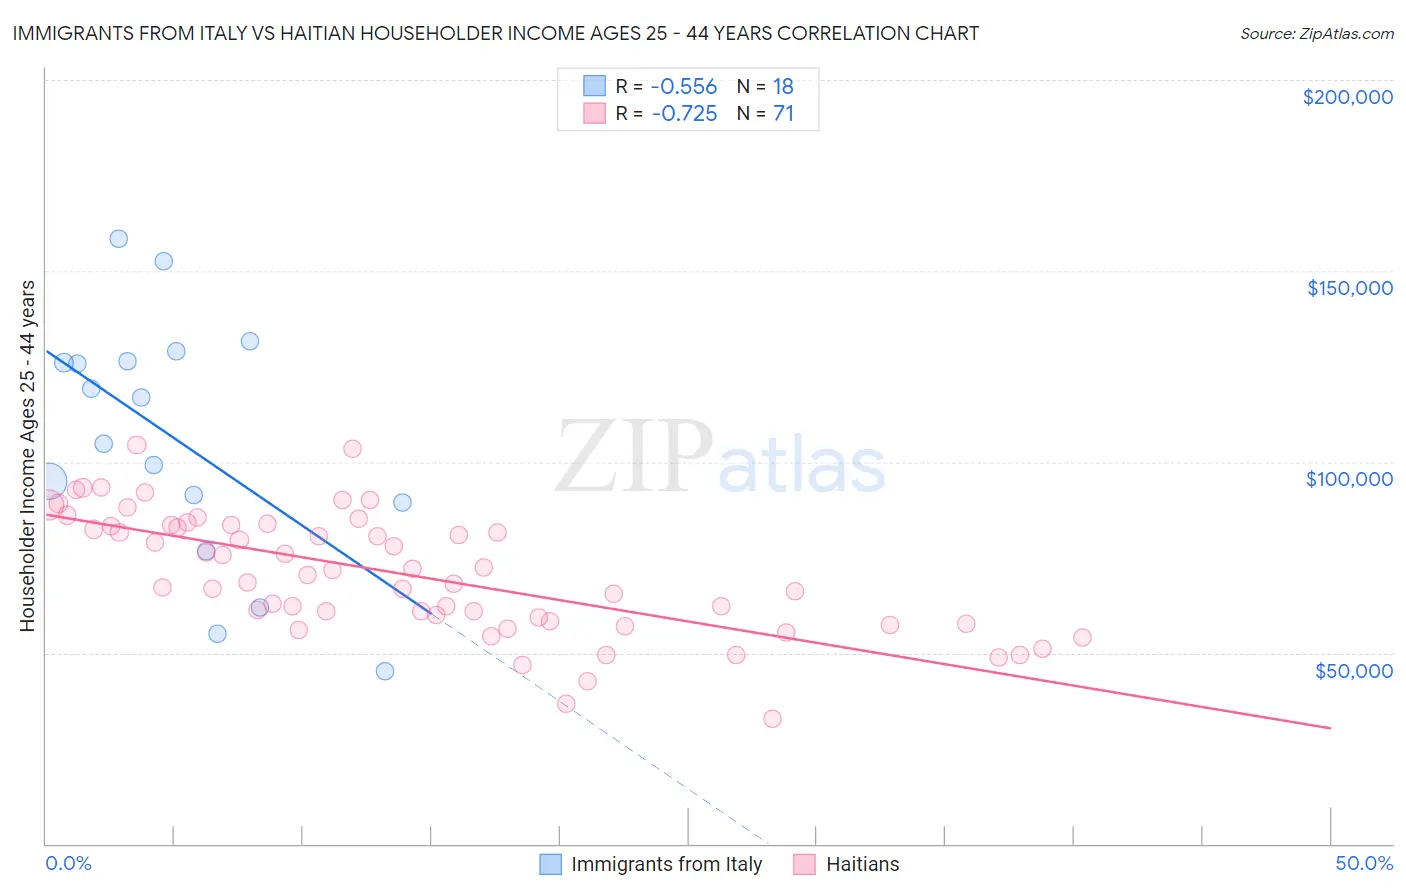
Immigrants from Italy vs Haitian Householder Income Ages 25 - 44 years Correlation Chart
The statistical analysis conducted on geographies consisting of 323,420,404 people shows a substantial negative correlation between the proportion of Immigrants from Italy and household income with householder between the ages 25 and 44 in the United States with a correlation coefficient (R) of -0.556 and weighted average of $105,201. Similarly, the statistical analysis conducted on geographies consisting of 287,311,076 people shows a strong negative correlation between the proportion of Haitians and household income with householder between the ages 25 and 44 in the United States with a correlation coefficient (R) of -0.725 and weighted average of $80,055, a difference of 31.4%.
Householder Income Ages 25 - 44 years Correlation Summary
| Measurement | Immigrants from Italy | Haitian |
| Minimum | $45,256 | $32,753 |
| Maximum | $158,531 | $104,312 |
| Range | $113,275 | $71,559 |
| Mean | $105,762 | $70,624 |
| Median | $110,729 | $70,361 |
| Interquartile 25% (IQ1) | $89,375 | $58,114 |
| Interquartile 75% (IQ3) | $126,307 | $83,419 |
| Interquartile Range (IQR) | $36,932 | $25,305 |
| Standard Deviation (Sample) | $31,956 | $15,852 |
| Standard Deviation (Population) | $31,055 | $15,740 |
Similar Demographics by Householder Income Ages 25 - 44 years
Demographics Similar to Immigrants from Italy by Householder Income Ages 25 - 44 years
In terms of householder income ages 25 - 44 years, the demographic groups most similar to Immigrants from Italy are Lithuanian ($105,223, a difference of 0.020%), Egyptian ($105,282, a difference of 0.080%), Immigrants from Scotland ($105,089, a difference of 0.11%), New Zealander ($105,085, a difference of 0.11%), and Immigrants from Netherlands ($105,082, a difference of 0.11%).
| Demographics | Rating | Rank | Householder Income Ages 25 - 44 years |
| Greeks | 99.9 /100 | #55 | Exceptional $106,457 |
| Immigrants | Pakistan | 99.8 /100 | #56 | Exceptional $106,129 |
| Immigrants | Austria | 99.8 /100 | #57 | Exceptional $106,103 |
| Immigrants | South Africa | 99.8 /100 | #58 | Exceptional $105,748 |
| Immigrants | Latvia | 99.8 /100 | #59 | Exceptional $105,522 |
| Egyptians | 99.7 /100 | #60 | Exceptional $105,282 |
| Lithuanians | 99.7 /100 | #61 | Exceptional $105,223 |
| Immigrants | Italy | 99.7 /100 | #62 | Exceptional $105,201 |
| Immigrants | Scotland | 99.7 /100 | #63 | Exceptional $105,089 |
| New Zealanders | 99.7 /100 | #64 | Exceptional $105,085 |
| Immigrants | Netherlands | 99.7 /100 | #65 | Exceptional $105,082 |
| Laotians | 99.7 /100 | #66 | Exceptional $104,993 |
| Immigrants | Romania | 99.6 /100 | #67 | Exceptional $104,713 |
| Immigrants | Eastern Europe | 99.6 /100 | #68 | Exceptional $104,662 |
| Mongolians | 99.6 /100 | #69 | Exceptional $104,578 |
Demographics Similar to Haitians by Householder Income Ages 25 - 44 years
In terms of householder income ages 25 - 44 years, the demographic groups most similar to Haitians are Immigrants from Central America ($80,012, a difference of 0.050%), Chippewa ($80,005, a difference of 0.060%), Fijian ($79,956, a difference of 0.12%), Apache ($80,260, a difference of 0.26%), and Immigrants from Dominican Republic ($80,319, a difference of 0.33%).
| Demographics | Rating | Rank | Householder Income Ages 25 - 44 years |
| Cherokee | 0.0 /100 | #300 | Tragic $80,843 |
| Immigrants | Micronesia | 0.0 /100 | #301 | Tragic $80,544 |
| Hispanics or Latinos | 0.0 /100 | #302 | Tragic $80,515 |
| Mexicans | 0.0 /100 | #303 | Tragic $80,427 |
| Immigrants | Caribbean | 0.0 /100 | #304 | Tragic $80,326 |
| Immigrants | Dominican Republic | 0.0 /100 | #305 | Tragic $80,319 |
| Apache | 0.0 /100 | #306 | Tragic $80,260 |
| Haitians | 0.0 /100 | #307 | Tragic $80,055 |
| Immigrants | Central America | 0.0 /100 | #308 | Tragic $80,012 |
| Chippewa | 0.0 /100 | #309 | Tragic $80,005 |
| Fijians | 0.0 /100 | #310 | Tragic $79,956 |
| Indonesians | 0.0 /100 | #311 | Tragic $79,543 |
| Immigrants | Haiti | 0.0 /100 | #312 | Tragic $79,391 |
| Menominee | 0.0 /100 | #313 | Tragic $79,358 |
| Cheyenne | 0.0 /100 | #314 | Tragic $79,152 |