Basque vs Central American Householder Income Ages 45 - 64 years
COMPARE
Basque
Central American
Householder Income Ages 45 - 64 years
Householder Income Ages 45 - 64 years Comparison
Basques
Central Americans
$103,387
HOUSEHOLDER INCOME AGES 45 - 64 YEARS
82.3/ 100
METRIC RATING
147th/ 347
METRIC RANK
$90,951
HOUSEHOLDER INCOME AGES 45 - 64 YEARS
0.9/ 100
METRIC RATING
246th/ 347
METRIC RANK
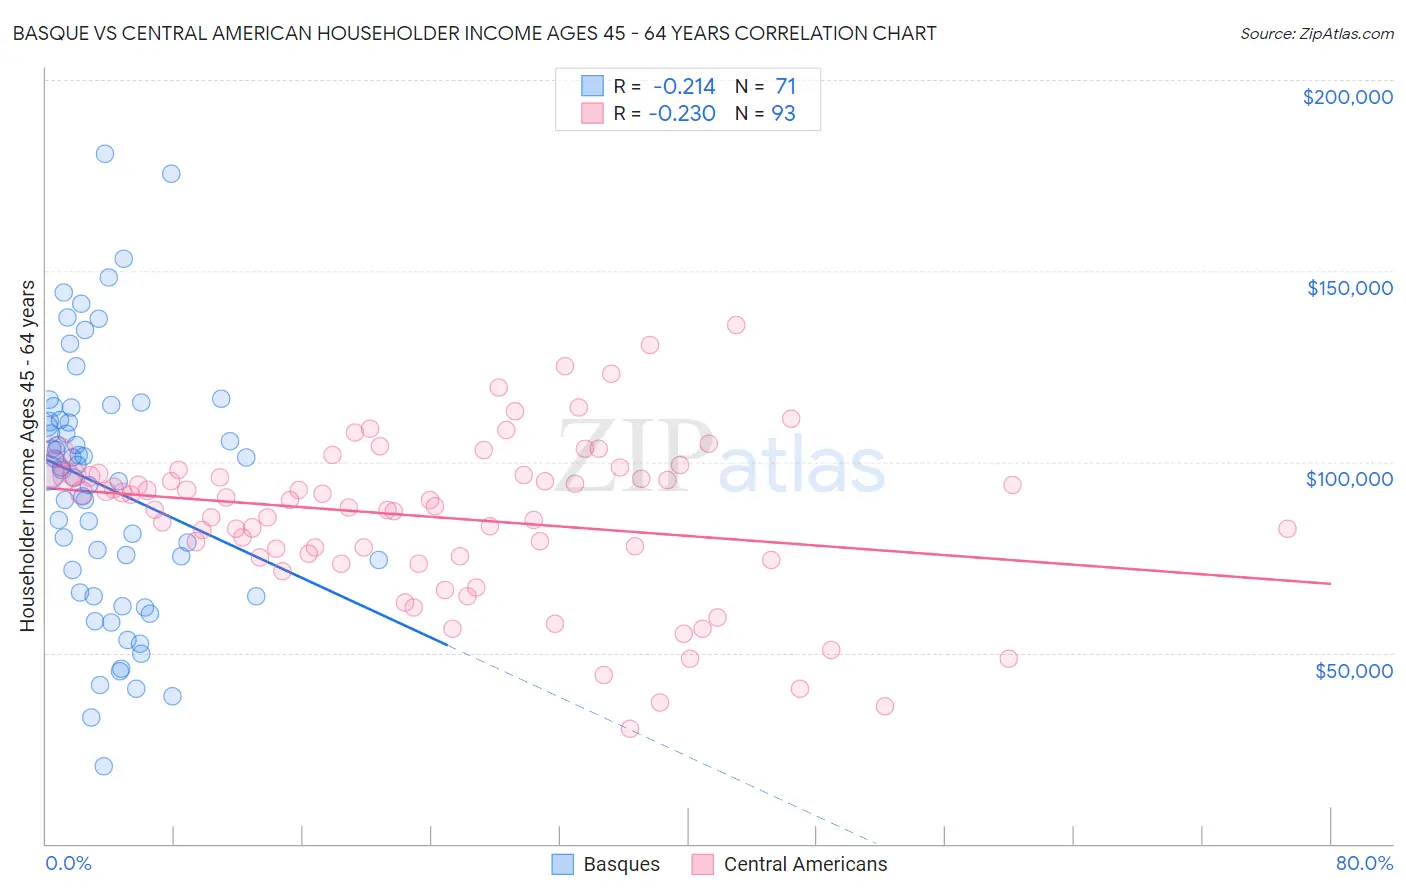
Basque vs Central American Householder Income Ages 45 - 64 years Correlation Chart
The statistical analysis conducted on geographies consisting of 165,668,497 people shows a weak negative correlation between the proportion of Basques and household income with householder between the ages 45 and 64 in the United States with a correlation coefficient (R) of -0.214 and weighted average of $103,387. Similarly, the statistical analysis conducted on geographies consisting of 502,874,075 people shows a weak negative correlation between the proportion of Central Americans and household income with householder between the ages 45 and 64 in the United States with a correlation coefficient (R) of -0.230 and weighted average of $90,951, a difference of 13.7%.
Householder Income Ages 45 - 64 years Correlation Summary
| Measurement | Basque | Central American |
| Minimum | $20,417 | $30,221 |
| Maximum | $180,563 | $135,944 |
| Range | $160,146 | $105,723 |
| Mean | $93,413 | $85,574 |
| Median | $97,827 | $89,913 |
| Interquartile 25% (IQ1) | $65,865 | $75,128 |
| Interquartile 75% (IQ3) | $110,957 | $96,782 |
| Interquartile Range (IQR) | $45,092 | $21,654 |
| Standard Deviation (Sample) | $33,150 | $20,953 |
| Standard Deviation (Population) | $32,916 | $20,840 |
Similar Demographics by Householder Income Ages 45 - 64 years
Demographics Similar to Basques by Householder Income Ages 45 - 64 years
In terms of householder income ages 45 - 64 years, the demographic groups most similar to Basques are Immigrants from Chile ($103,412, a difference of 0.020%), Ugandan ($103,472, a difference of 0.080%), Immigrants from Germany ($103,282, a difference of 0.10%), Czech ($103,507, a difference of 0.12%), and Serbian ($103,522, a difference of 0.13%).
| Demographics | Rating | Rank | Householder Income Ages 45 - 64 years |
| Norwegians | 84.3 /100 | #140 | Excellent $103,682 |
| Immigrants | Uganda | 83.7 /100 | #141 | Excellent $103,584 |
| Luxembourgers | 83.3 /100 | #142 | Excellent $103,536 |
| Serbians | 83.2 /100 | #143 | Excellent $103,522 |
| Czechs | 83.1 /100 | #144 | Excellent $103,507 |
| Ugandans | 82.9 /100 | #145 | Excellent $103,472 |
| Immigrants | Chile | 82.5 /100 | #146 | Excellent $103,412 |
| Basques | 82.3 /100 | #147 | Excellent $103,387 |
| Immigrants | Germany | 81.5 /100 | #148 | Excellent $103,282 |
| Immigrants | Sierra Leone | 81.1 /100 | #149 | Excellent $103,227 |
| Immigrants | Peru | 80.7 /100 | #150 | Excellent $103,173 |
| Swiss | 79.9 /100 | #151 | Good $103,071 |
| Irish | 79.8 /100 | #152 | Good $103,067 |
| Scandinavians | 79.0 /100 | #153 | Good $102,969 |
| Slovenes | 78.3 /100 | #154 | Good $102,885 |
Demographics Similar to Central Americans by Householder Income Ages 45 - 64 years
In terms of householder income ages 45 - 64 years, the demographic groups most similar to Central Americans are Alaskan Athabascan ($90,951, a difference of 0.0%), Guyanese ($90,966, a difference of 0.020%), Immigrants from Laos ($90,909, a difference of 0.050%), Mexican American Indian ($90,811, a difference of 0.15%), and Subsaharan African ($90,691, a difference of 0.29%).
| Demographics | Rating | Rank | Householder Income Ages 45 - 64 years |
| Immigrants | Ecuador | 1.2 /100 | #239 | Tragic $91,462 |
| Immigrants | Burma/Myanmar | 1.1 /100 | #240 | Tragic $91,385 |
| Trinidadians and Tobagonians | 1.1 /100 | #241 | Tragic $91,357 |
| Inupiat | 1.1 /100 | #242 | Tragic $91,355 |
| Immigrants | Trinidad and Tobago | 1.1 /100 | #243 | Tragic $91,347 |
| Immigrants | Middle Africa | 1.1 /100 | #244 | Tragic $91,293 |
| Guyanese | 0.9 /100 | #245 | Tragic $90,966 |
| Central Americans | 0.9 /100 | #246 | Tragic $90,951 |
| Alaskan Athabascans | 0.9 /100 | #247 | Tragic $90,951 |
| Immigrants | Laos | 0.9 /100 | #248 | Tragic $90,909 |
| Mexican American Indians | 0.8 /100 | #249 | Tragic $90,811 |
| Sub-Saharan Africans | 0.8 /100 | #250 | Tragic $90,691 |
| Americans | 0.7 /100 | #251 | Tragic $90,536 |
| Marshallese | 0.7 /100 | #252 | Tragic $90,455 |
| Barbadians | 0.6 /100 | #253 | Tragic $90,266 |