Pima vs Central American Householder Income Ages 45 - 64 years
COMPARE
Pima
Central American
Householder Income Ages 45 - 64 years
Householder Income Ages 45 - 64 years Comparison
Pima
Central Americans
$73,365
HOUSEHOLDER INCOME AGES 45 - 64 YEARS
0.0/ 100
METRIC RATING
343rd/ 347
METRIC RANK
$90,951
HOUSEHOLDER INCOME AGES 45 - 64 YEARS
0.9/ 100
METRIC RATING
246th/ 347
METRIC RANK
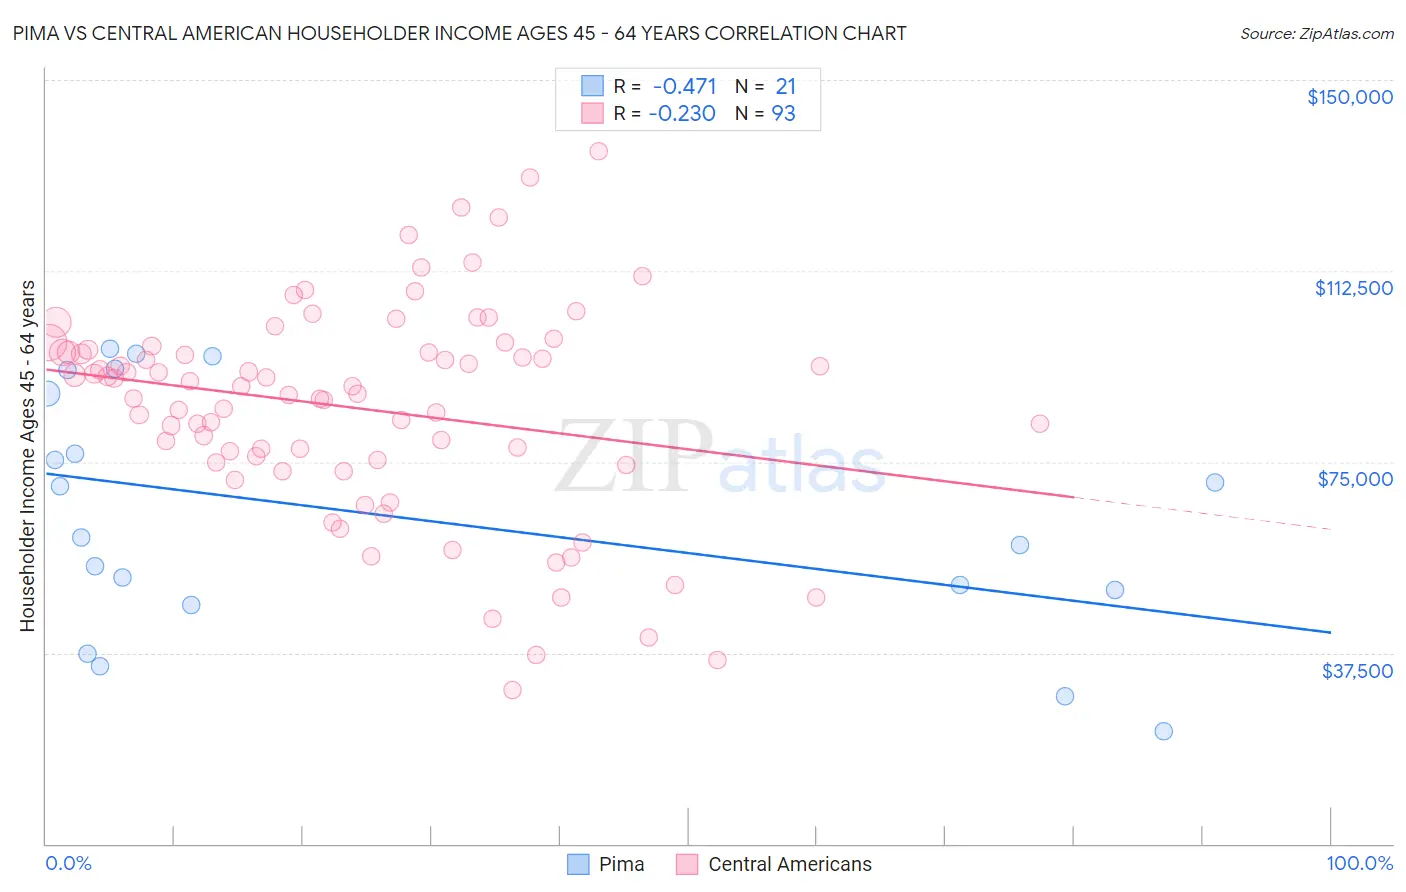
Pima vs Central American Householder Income Ages 45 - 64 years Correlation Chart
The statistical analysis conducted on geographies consisting of 61,504,039 people shows a moderate negative correlation between the proportion of Pima and household income with householder between the ages 45 and 64 in the United States with a correlation coefficient (R) of -0.471 and weighted average of $73,365. Similarly, the statistical analysis conducted on geographies consisting of 502,874,075 people shows a weak negative correlation between the proportion of Central Americans and household income with householder between the ages 45 and 64 in the United States with a correlation coefficient (R) of -0.230 and weighted average of $90,951, a difference of 24.0%.
Householder Income Ages 45 - 64 years Correlation Summary
| Measurement | Pima | Central American |
| Minimum | $22,031 | $30,221 |
| Maximum | $97,330 | $135,944 |
| Range | $75,299 | $105,723 |
| Mean | $64,464 | $85,574 |
| Median | $60,256 | $89,913 |
| Interquartile 25% (IQ1) | $48,406 | $75,128 |
| Interquartile 75% (IQ3) | $90,706 | $96,782 |
| Interquartile Range (IQR) | $42,300 | $21,654 |
| Standard Deviation (Sample) | $23,791 | $20,953 |
| Standard Deviation (Population) | $23,218 | $20,840 |
Similar Demographics by Householder Income Ages 45 - 64 years
Demographics Similar to Pima by Householder Income Ages 45 - 64 years
In terms of householder income ages 45 - 64 years, the demographic groups most similar to Pima are Tohono O'odham ($73,774, a difference of 0.56%), Crow ($74,257, a difference of 1.2%), Immigrants from Yemen ($74,575, a difference of 1.7%), Houma ($72,093, a difference of 1.8%), and Kiowa ($74,815, a difference of 2.0%).
| Demographics | Rating | Rank | Householder Income Ages 45 - 64 years |
| Immigrants | Congo | 0.0 /100 | #333 | Tragic $77,850 |
| Menominee | 0.0 /100 | #334 | Tragic $76,903 |
| Cheyenne | 0.0 /100 | #335 | Tragic $76,362 |
| Arapaho | 0.0 /100 | #336 | Tragic $75,945 |
| Pueblo | 0.0 /100 | #337 | Tragic $75,601 |
| Hopi | 0.0 /100 | #338 | Tragic $75,562 |
| Kiowa | 0.0 /100 | #339 | Tragic $74,815 |
| Immigrants | Yemen | 0.0 /100 | #340 | Tragic $74,575 |
| Crow | 0.0 /100 | #341 | Tragic $74,257 |
| Tohono O'odham | 0.0 /100 | #342 | Tragic $73,774 |
| Pima | 0.0 /100 | #343 | Tragic $73,365 |
| Houma | 0.0 /100 | #344 | Tragic $72,093 |
| Navajo | 0.0 /100 | #345 | Tragic $69,759 |
| Puerto Ricans | 0.0 /100 | #346 | Tragic $69,234 |
| Lumbee | 0.0 /100 | #347 | Tragic $65,113 |
Demographics Similar to Central Americans by Householder Income Ages 45 - 64 years
In terms of householder income ages 45 - 64 years, the demographic groups most similar to Central Americans are Alaskan Athabascan ($90,951, a difference of 0.0%), Guyanese ($90,966, a difference of 0.020%), Immigrants from Laos ($90,909, a difference of 0.050%), Mexican American Indian ($90,811, a difference of 0.15%), and Subsaharan African ($90,691, a difference of 0.29%).
| Demographics | Rating | Rank | Householder Income Ages 45 - 64 years |
| Immigrants | Ecuador | 1.2 /100 | #239 | Tragic $91,462 |
| Immigrants | Burma/Myanmar | 1.1 /100 | #240 | Tragic $91,385 |
| Trinidadians and Tobagonians | 1.1 /100 | #241 | Tragic $91,357 |
| Inupiat | 1.1 /100 | #242 | Tragic $91,355 |
| Immigrants | Trinidad and Tobago | 1.1 /100 | #243 | Tragic $91,347 |
| Immigrants | Middle Africa | 1.1 /100 | #244 | Tragic $91,293 |
| Guyanese | 0.9 /100 | #245 | Tragic $90,966 |
| Central Americans | 0.9 /100 | #246 | Tragic $90,951 |
| Alaskan Athabascans | 0.9 /100 | #247 | Tragic $90,951 |
| Immigrants | Laos | 0.9 /100 | #248 | Tragic $90,909 |
| Mexican American Indians | 0.8 /100 | #249 | Tragic $90,811 |
| Sub-Saharan Africans | 0.8 /100 | #250 | Tragic $90,691 |
| Americans | 0.7 /100 | #251 | Tragic $90,536 |
| Marshallese | 0.7 /100 | #252 | Tragic $90,455 |
| Barbadians | 0.6 /100 | #253 | Tragic $90,266 |