Immigrants from El Salvador vs Central American Householder Income Ages 45 - 64 years
COMPARE
Immigrants from El Salvador
Central American
Householder Income Ages 45 - 64 years
Householder Income Ages 45 - 64 years Comparison
Immigrants from El Salvador
Central Americans
$93,176
HOUSEHOLDER INCOME AGES 45 - 64 YEARS
2.7/ 100
METRIC RATING
234th/ 347
METRIC RANK
$90,951
HOUSEHOLDER INCOME AGES 45 - 64 YEARS
0.9/ 100
METRIC RATING
246th/ 347
METRIC RANK
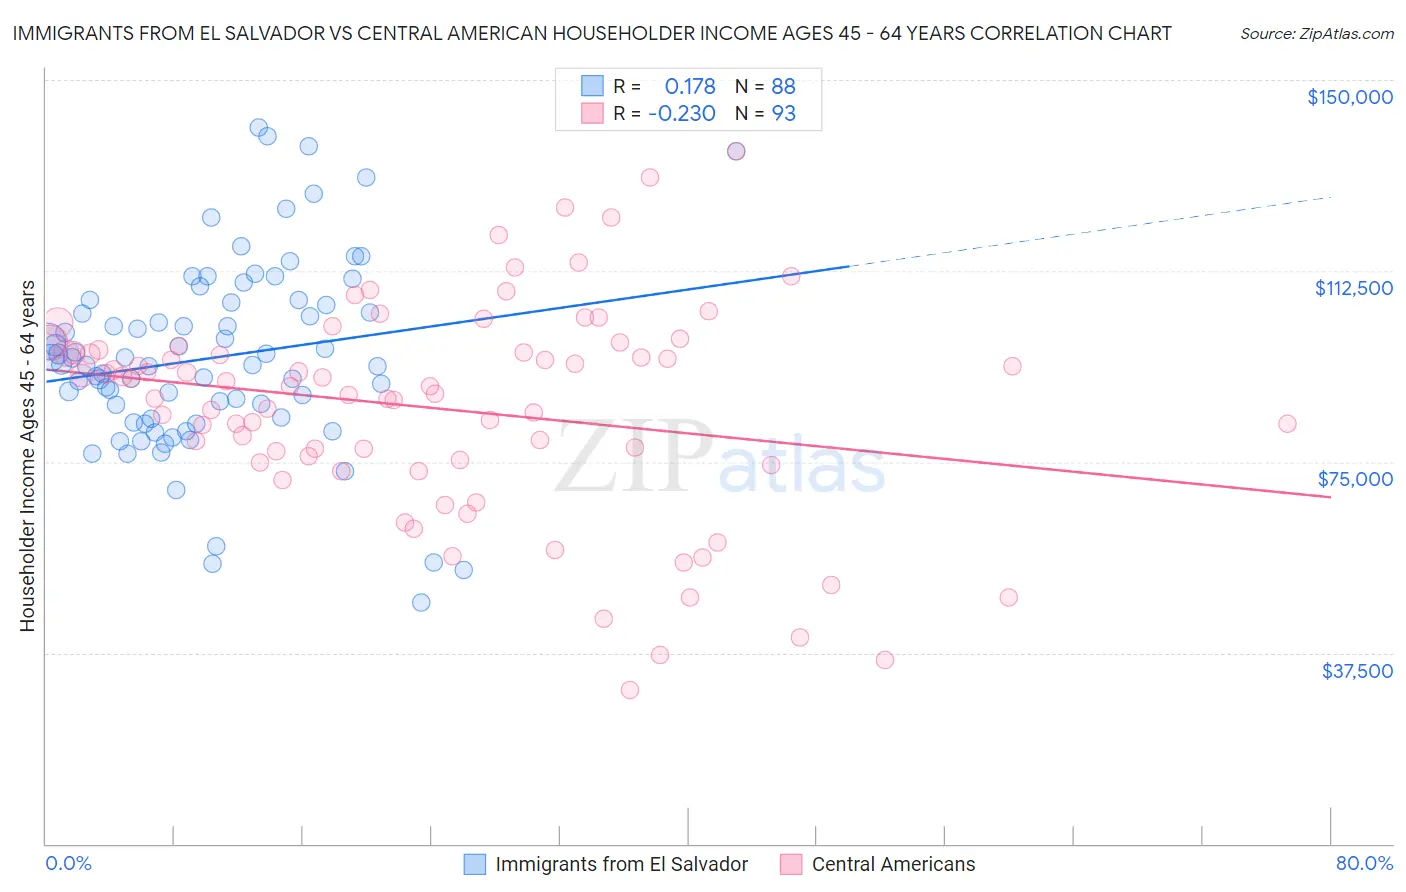
Immigrants from El Salvador vs Central American Householder Income Ages 45 - 64 years Correlation Chart
The statistical analysis conducted on geographies consisting of 357,351,830 people shows a poor positive correlation between the proportion of Immigrants from El Salvador and household income with householder between the ages 45 and 64 in the United States with a correlation coefficient (R) of 0.178 and weighted average of $93,176. Similarly, the statistical analysis conducted on geographies consisting of 502,874,075 people shows a weak negative correlation between the proportion of Central Americans and household income with householder between the ages 45 and 64 in the United States with a correlation coefficient (R) of -0.230 and weighted average of $90,951, a difference of 2.5%.
Householder Income Ages 45 - 64 years Correlation Summary
| Measurement | Immigrants from El Salvador | Central American |
| Minimum | $47,339 | $30,221 |
| Maximum | $140,748 | $135,944 |
| Range | $93,409 | $105,723 |
| Mean | $95,436 | $85,574 |
| Median | $94,032 | $89,913 |
| Interquartile 25% (IQ1) | $83,646 | $75,128 |
| Interquartile 75% (IQ3) | $106,007 | $96,782 |
| Interquartile Range (IQR) | $22,361 | $21,654 |
| Standard Deviation (Sample) | $18,513 | $20,953 |
| Standard Deviation (Population) | $18,408 | $20,840 |
Demographics Similar to Immigrants from El Salvador and Central Americans by Householder Income Ages 45 - 64 years
In terms of householder income ages 45 - 64 years, the demographic groups most similar to Immigrants from El Salvador are Nepalese ($93,355, a difference of 0.19%), Sudanese ($93,718, a difference of 0.58%), Ecuadorian ($93,739, a difference of 0.60%), Immigrants from Sudan ($93,781, a difference of 0.65%), and Nicaraguan ($92,554, a difference of 0.67%). Similarly, the demographic groups most similar to Central Americans are Alaskan Athabascan ($90,951, a difference of 0.0%), Guyanese ($90,966, a difference of 0.020%), Immigrants from Laos ($90,909, a difference of 0.050%), Mexican American Indian ($90,811, a difference of 0.15%), and Subsaharan African ($90,691, a difference of 0.29%).
| Demographics | Rating | Rank | Householder Income Ages 45 - 64 years |
| Immigrants | Sudan | 3.6 /100 | #230 | Tragic $93,781 |
| Ecuadorians | 3.6 /100 | #231 | Tragic $93,739 |
| Sudanese | 3.5 /100 | #232 | Tragic $93,718 |
| Nepalese | 3.0 /100 | #233 | Tragic $93,355 |
| Immigrants | El Salvador | 2.7 /100 | #234 | Tragic $93,176 |
| Nicaraguans | 2.0 /100 | #235 | Tragic $92,554 |
| Immigrants | Western Africa | 1.8 /100 | #236 | Tragic $92,384 |
| Immigrants | Bangladesh | 1.7 /100 | #237 | Tragic $92,208 |
| Pennsylvania Germans | 1.5 /100 | #238 | Tragic $91,956 |
| Immigrants | Ecuador | 1.2 /100 | #239 | Tragic $91,462 |
| Immigrants | Burma/Myanmar | 1.1 /100 | #240 | Tragic $91,385 |
| Trinidadians and Tobagonians | 1.1 /100 | #241 | Tragic $91,357 |
| Inupiat | 1.1 /100 | #242 | Tragic $91,355 |
| Immigrants | Trinidad and Tobago | 1.1 /100 | #243 | Tragic $91,347 |
| Immigrants | Middle Africa | 1.1 /100 | #244 | Tragic $91,293 |
| Guyanese | 0.9 /100 | #245 | Tragic $90,966 |
| Central Americans | 0.9 /100 | #246 | Tragic $90,951 |
| Alaskan Athabascans | 0.9 /100 | #247 | Tragic $90,951 |
| Immigrants | Laos | 0.9 /100 | #248 | Tragic $90,909 |
| Mexican American Indians | 0.8 /100 | #249 | Tragic $90,811 |
| Sub-Saharan Africans | 0.8 /100 | #250 | Tragic $90,691 |